
This week the S+P 500 turned positive for the year to date while also making another new all time high.
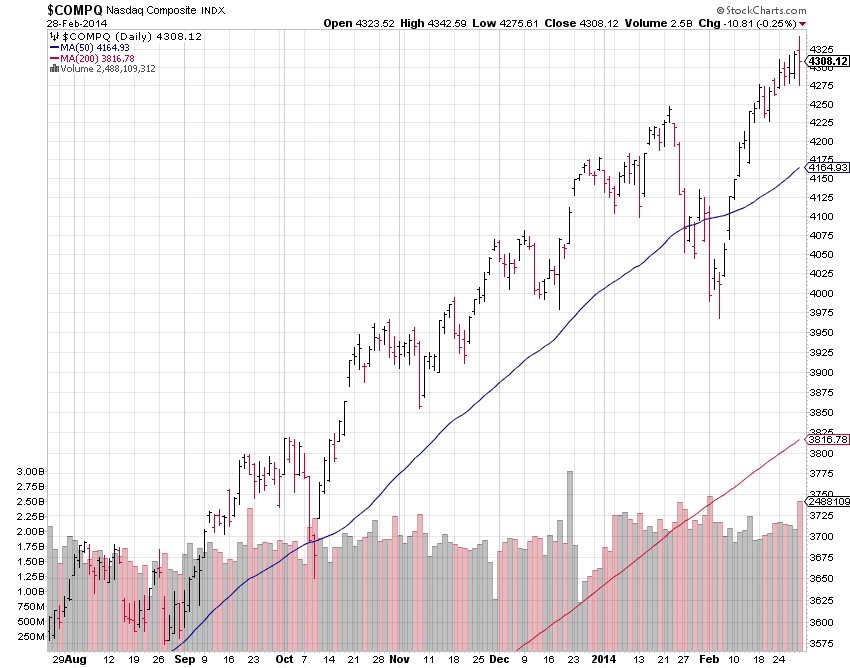
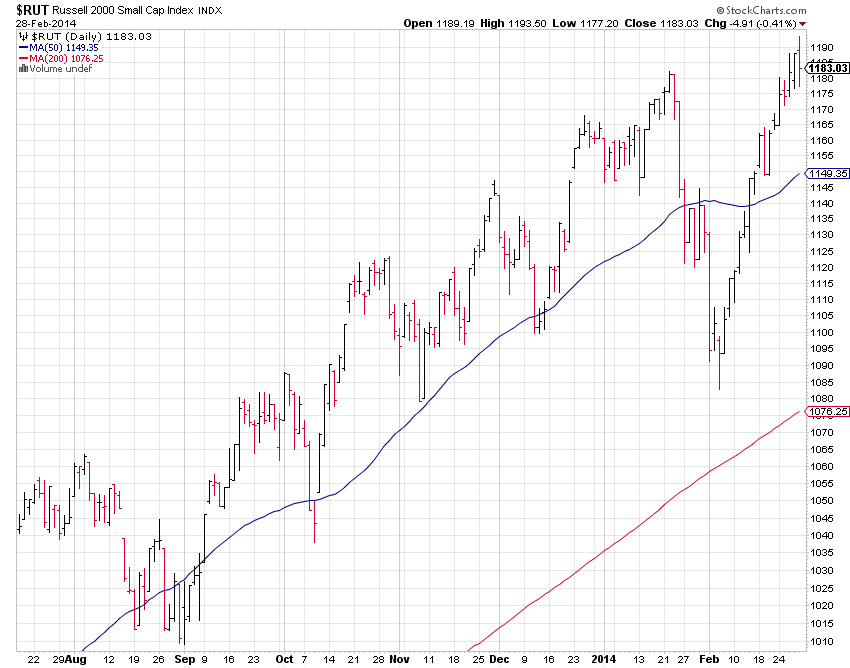
The Nasdaq and the Russell 2000 (small caps) also made new bull market highs.

The Dow Jones Industrial Average is still trading below it's 2013 highs and long term resistance. Although with the momentum being made in the other major averages it's likely the Dow will take another run back up into long term resistance. And if successful, a push up above 17,000 is likely. As that would match the size of the last 1800 point rally the last time the Dow tested it's 200 day moving average at the end of last year.

It's look to me that the next logical upside target comes from the S+P 100 (OEX). The chart above shows this large cap index is still trading below it's 2007 highs. But those highs are approaching about 3.5% away from Friday's close.

Now there are some mixed signals to monitor as well. The sector performance year to date shows the bulk of the gains coming from the Health Care and Utility sectors.

The Financial sector, which accounts for approximately 17% of the S+P 500 and the second largest sector (Technology being the first). Has failed to make new highs and so far has struggled to regain positive territory year to date.

Also the spread between high yield and treasury bonds continues to remain in neutral territory. Catching a bounce off it's 200 day moving average back into it's 50 day moving average. Credit market indicators like this can be helpful in the context of a full market analysis.


However the market breadth for this advance has been stellar. Judged by the cumulative advance-decline lines (New York Stock Exchange - top chart, S+P 500 - bottom chart). Both indicators are making new highs and trading well above their 2013 highs. This shows a broad based advance on both fronts, it's hard to get a major trend change with internal readings as strong as this.

The performance by asset class now that we have two months in the books, continues to show Gold and Bonds out-performance while the S+P 500 turns positive.

The trend matrix continues it's bullish stance, actually getting a little more bullish as the Consumer Staples sector turns bullish from neutral. I have also replaced the telecom sector with the Dow Jones Transportation Index. This tool is NOT a leading indicator that spots tops and bottoms in advance, rather it's a useful tool to gauge the overall trend and the strength thereof, thus helping to define the risk/reward, and most importantly filter out the noise.
So in conclusion, even though I'm not excited about the risk to reward at these price levels especially in light of the fact that we have moved quite a bit higher over the last three years without a meaningful correction. It's important to remain flexible with your analysis. There is absolutely no reason to be a hero and try to pick market tops. The bottom line is, for now, the trend's are up and the bulls remain in control. With that being said it's also prudent to remain balanced and not become overly enamored with these big moves and end up taking on more risk than one really can tolerate.
Safe investing and trading!
Safe investing and trading!