Saturday, October 26, 2013

Despite weak jobs growth, another new high for S+P 500 on slow trading week (Amazon earnings)...


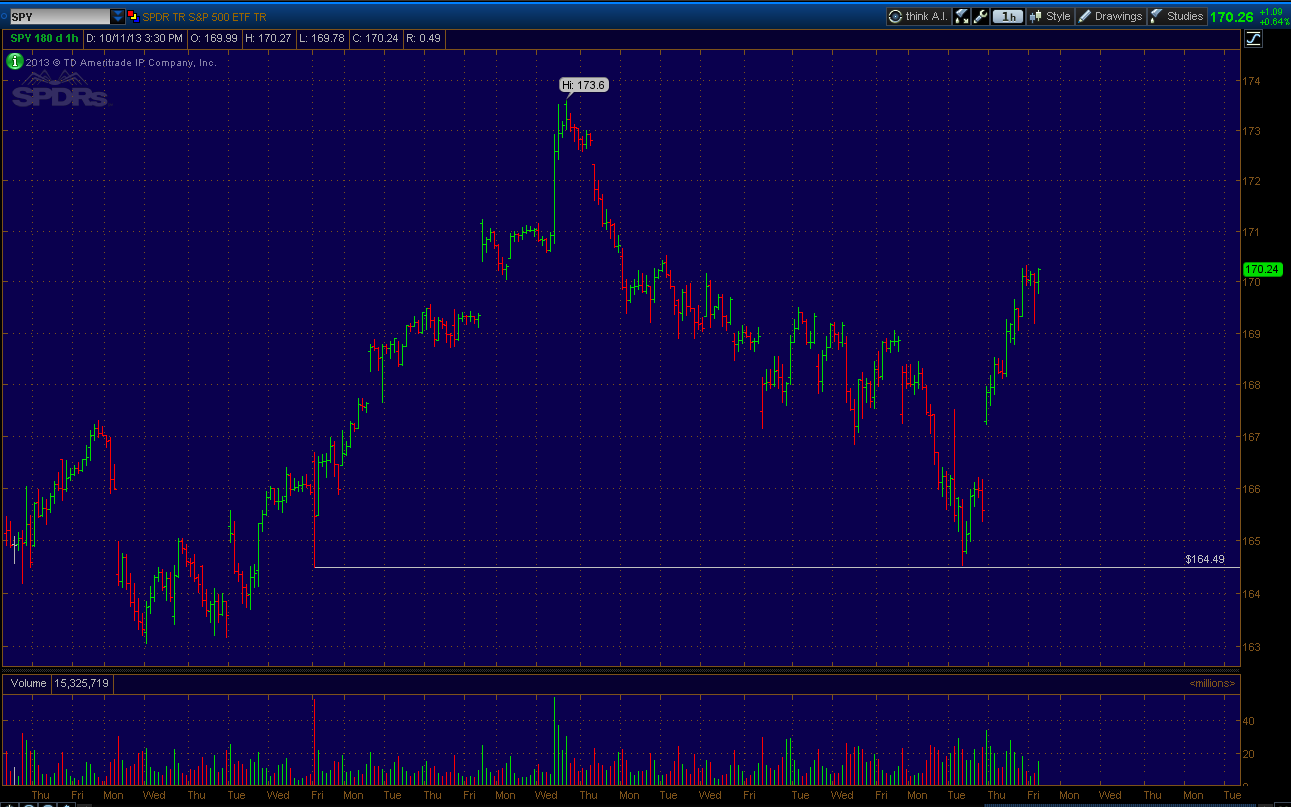
The major market averages saw a gap up on Monday which sellers took advantage of before the release of the delayed jobs/unemployment report for September was released on Tuesday. The number of jobs created turned out to be 148k, lower than the 182k forecast estimates. This kicked off a sell off of about 18 points in the S+P 500 as depicted in the chart above. That is about the same size as the last biggest drop in the S+P since the swing low was formed on October 9th.

That reaction was met by buyers possibly assuming that weak jobs report equals continued quantitative easing at least until March 2014. The S+P 500 closed the week at an all time high off of a relatively quiet week compared to the previous few.


The next upside target in the S+P 500 comes in at 1778.56 as depicted in the chart above. This would match the size of the rally off the 2009 lows into the 2011 high that occurred before the 19% drop in the S+P and 21% drop in the Dow occurred after a US debt rating downgrade and Eurozone instability sent stocks down in a hurry.

I do believe we will trade higher than 1778, as the Dow gives us a much more reliable upside target that is still a ways off. If ones time horizon is short term then the chart above shows the potential unfavorable risk/reward of establishing new positions here and now.


Looking at the Dow, we can see it is still trading below it's July high as the S+P 500 is making new all time highs each day. This is a potential divergence seen at a conclusion of a bull market, however these divergences can take time to play itself out.


This chart above of the Dow shows our maximum upside target coming in around 16,500 - 16,700. It is still a ways off but I simply can not see a way that we can get much higher than that without a good 20-30% correction. That is not doom and gloom, that is simply historical patterns. I am very bullish for the long term and believe ten years from now these current prices will seem like a bargain!


The advance - decline line continues in it's strong breakout above the May and July highs. This also bodes well for higher stocks prices in the near term.


Taking a look at sector performance relative to the S+P 500 since the October 9th low.


Also take a look at performance by market cap since the October 9th low. Not bad at all.


A quick look on the earnings front, we talked about Netflix (NFLX) during the week, the other notable was Amazon.com (AMZN). The stock closed up Friday by almost ten percent as revenues continue to accelerate and margins improve.

A technical overview shows a stock in a solid uptrend but has taken off a bit too much to chase at this point. The chart above shows two separate 30% corrections in the stock as a measuring stick of a future break in trend. It's incredibly hard and arguably fruitless to put solid resistance levels on an individual stock with stellar performance and trading at all time highs.

However one potential target spot and area to "keep an eye on" may be the $378 level. At which point it would match the size of the rally off the 2008 lows to the last major swing high before the biggest correction took place.

So in conclusion, as a trader there are still opportunities on both the long and short side of the market. However as an investor or longer term swing trader I see only two areas of significant interest when it comes to establishing new positions.

I am interested in the Dow 16,500 area and possibly 16,000, if I wanted to front run just in case, as areas I would get short into. I would target the QE 3 announcement high in the S+P 500 at 1474 with a max downside target of 1363 which is the 2011 high before the biggest correction in this current bull market took place.

On the long side I would be interested in buying both S+P 500 downside targets mentioned (1474,1363) and I would target much higher prices above 2000 on the S+P 500 over time. Generally I would stick with the higher beta plays like small caps and technology.

Otherwise all I see that you can do here is trade around important levels.

Tuesday, October 22, 2013

Netflix (NFLX) price action post earnings...


Today's price action in Netflix caught my eye so I wanted to create a separate post on it today, rather than wait until the weekend. Netflix (NFLX) reported it's quarterly earnings after the bell yesterday.
The outcome was that its net income rose 315% to $31.8 million for the quarter that ended Sept. 30. Earnings per share of 52 cents beat analysts' average estimate of 49 cents and revenue rose 22% to $1.1 billion.

The stock soared almost 10% after the announcement and opened the trading session near the $400 level. However those price levels attracted some high volume sellers and the outcome was an outside reversal day to the downside on heavy volume. Now this does not necessarily mean that the top is in and it certainly doesn't mean it is now headed below $100 or some outrageous price target. But price action like today does usually mean that there is a high probability of some follow through to today's reversal trend.

The chart above is a weekly price chart of Netflix since it's inception going all the way back to 2002. I've noted on the chart how today's open actually matched and exceeded it's last major bull market run from it's all time low to it's 2011 bull market high. Just like we saw in Google during last week's post, these type of measured moves can be important. And when we see price action like what we saw today it can be telling.


So know let's look at a daily price chart and focus on this current bull market run from the 2011 lows. Each correction has been between 40-50 points in length and around 15-19%. Today's drop has already produced a 67.66 point drop.

I am going to place resistance now at the $355 level, which is the prior closing high, approximately the midpoint of today's range, and it stands as the point in which the current bull market matches the size of the 2002-2011 bull market. If we can trade above then this may be a shakeout, but as long as we remain below the probabilities favor lower prices to find support going forward.

First support zone should come in around $304 as defined on the chart above. That level is the 2011 bull market high and would about double the amount of the most common correction size (40 pts). The next likely support area would come in around the $260-$270 level. There we have a prior swing high, the 38.2% retracement of the bull market starting in 2011, and would double the size of the biggest correction so far (50 pts).

Netflix has been the best performer in the S+P 500 and has had a remarkable run in the last two years. And this doesn't mean the party is over, however using some caution here would certainly be prudent in my opinion.

Saturday, October 19, 2013

S+P 500 closes at all time high as default avoided, earnings take center stage (Google, JP Morgan, IBM, American Express )...


As the eleventh hour short term resolution became a reality this week, stocks continued their upwards momentum closing at another new all time high in the S+P 500. In the short term I can see some minor resistance above around the 1750 level on the S+P 500 as depicted in the above chart. The area is defined by the length the market proceeded above it's previous highs (roughly 20 pts) along with matching the size of the previous rally off the 1626 low into the "no taper" Fed announcement top.

Now since the last major swing low at 1646, the biggest drop has been about 15.5 pts. So it is entirely possible for a pause in the market to retrace back somewhere in the vicinity of that amount, or even twice that amount (30pts), since we have seen a 100 handle move in the S+P 500 in a short amount of time.

Look for support to now stand at those previous swing high pivots, 1729 and 1709 respectively. This market is likely headed to 1775 and probably higher over the coming months, as upside targets on both the Dow and the S+P are defined in this prior post.

 
As earnings come back into focus, let's take a quick look at the technical structure and price trends of a few of the companies that have already reported earnings.
 
JP Morgan Chase (JPM) reported it's earnings last week and also this week there were reports of a settlement reached with the FHFA. In terms of technical price action I see a stock that is likely headed back up to $56. This is defined by the length of the previous two trading ranges. The fact that the stock was able to hold above the high of it's previous trading range on 3-4 separate occasions was a bullish signal. I would be targeting the $61 level going forward.
 
Below $50 would likely push the share price back down to the $46 level and probably even the $43.50-$44.50 area before finding stronger long term support.
 
 
Next we have IBM. IBM reported it's earnings this week, posting a miss on revenue and a beat on EPS. Sellers became more aggressive and took the share price down to another new low for year to date.
 
In order to analyze the technical structure I have taken a step back and observed the bigger picture in the chart above. This chart above is showing the entire bull market run from 2008 lows. One thing we can immediately see is that this current correction we find ourselves in is already bigger than any of the previous corrections of the past 5 years. Until then we have had 3 corrections of roughly the same size (13.59% - 15.35% and 28 points in length). Even before this weeks earnings announcement we had already broken this "rhythm", which at the very least would be a yellow light.
 
So it may be that this trend is broken, one major area I would be watching is the $160 level. This is defined by a previous pivot low in the vicinity, it would also be 2x the size of the biggest correction in terms of points, and most importantly the 38.2% retracement level of this entire bull market run. I think there is a high probability that support will be found in that vicinity, at least in the short term.
 
Otherwise this is a technical trend that has been broken and would likely make a run for the $135 level and possibly lower.
 
 
Google (GOOG) also reported it's earnings this week. And according to the demand that followed, there wasn't much that buyers did not like.

I have done a few posts on this price chart over the years, over a year ago I posted a chart highlighting the $900 price level as being the area that would match the size of the previous bull market in this stock, following it's IPO. The stock price hovered around that price target for about 6 months before breakout out above $1000 on Friday, one of the biggest one day gains in terms of dollar amount, that I can remember.

Unless this stock takes out it's rising trend line below and shows weakness below it's 2007 bull market high at $747, I can see no reason to be long term bearish on this name. It's a tough one to chase at this point and I would advise against it. But it certainly appears as if this momentum will continue.


Lastly we have American Express (AXP), they also reported earnings this week and basically knocked the cover off the ball. This stock has had a great run year to date and is poised to continue that upward momentum into year's end.

The stock price spent the better part of the summer range bound, roughly between $72 and $78 (6 points). This momentum and energy will likely take the share price to at least $84 in the near term.


Another important piece of information is the fact that as of Friday's close, the cumulative advance - decline has finally broken out to the upside of it's 6 month trading range. This bodes well for higher prices in the future.

Saturday, October 12, 2013

Stocks find support midweek and finish strong as possibilities of compromise arise...

 
In last week's post we talked about the possibility of further weakness taking the S+P 500 down into the 1640's which would likely cap the downside. And that is exactly what happened. On Wednesday the S+P 500 dropped as low as 1646.47, at that point the correction was exactly 83.39 points in length. Almost identical to the previous correction from the high at 1709 (82.20 points-highlighted on chart above). It goes to show you that the best trades/investments almost always fly in the face of most current market data!
 
 
The SPY (S+P 500 ETF) actually tested the exact spot that was pointed out in last week's post.
 
 
The Dow Jones Industrial Average briefly took out it's lows, likely gunning for stops below, before reversing higher. You can see the divergence between the S+P and Dow, as the Dow has farther to go to make new highs and is only at it's midpoint of the September drop. Resistance will likely come in play around the 15,330 area, I don't expect this to be more than short term resistance but it is worth noting regardless.
 
On a quick side note, I hear a lot of people talk about placing their protective stops above or below key highs and lows. While I commend the discipline and risk management, placing these kind of orders directly above or below key pivot points is a sure fire way for losing your money. As the market generally has to auction above or below key pivot points to generate interest from the buyers/sellers to continue it's general trend.
 
 
Moving on, the Russell 2000 index is made up of small cap, mostly domestic companies. This is a very good index to watch to gauge the level of risk investor's are willing to take. This chart above shows a very healthy uptrend that is just shy of closing at all time highs.
 
 
The Nasdaq composite also shows a healthy uptrend, trading at the upper end of it's yearly range.
 

Taking a look at Bonds using the US long bond etf (TLT). We can see a short term down trend potentially building a base around the $102 low. We can also see that each short covering rally in the last two years have pushed higher by about $9 points. This will project around $111-$112 as resistance which there happens to be a couple swing lows in the vicinity and a 200 day moving average above. That is probably your best entry for shorts, a break out above would most likely produce a move up to $120 or so.


Tracking the US dollar using the etf UUP, we can see a pretty obvious downtrend longer term. This week we briefly took out this year's low to date and the 2012 low, before moving back above. This definitely has the potential for a short squeeze with a possibility of reaching that upper trend line above.
 
 
The Dow Jones Transportation Index remains strong as well. Also trading at the upper end of it's yearly range.
 

The cumulative advance decline line got a solid bounce this week as well. The big question remains, will we finally see an upside breakout? Really everything else in between doesn't really matter.

 
So what should we expect going forward? Personally I think the lows are in and the S+P 500 is headed up to at least 1775 and 16,500 on the Dow, over the coming months. Historically when we have a very good 1st quarter, we tend to close the year out well also. However in the short term we have moved quite a bit higher in a short amount of time. I expect to find some resistance around the 1709 area.
 
A scenario I could see playing out is highlighted on the above chart. 1670-75 should now define downside support for the next move higher. That would setup an inverted head and shoulders pattern (albeit a distorted one) that would target new all time highs.
 
So in conclusion, we are likely to see more short term volatility as Congress goes back and forth on an eventual resolution to the debt ceiling. But the probabilities that the low is in are strong. We should be on our way to our upside targets in the major averages.
 
We should also be aware that this bull market, by historical standards, is getting old. That doesn't mean that it has to end anytime soon, but any weakness should be taken seriously. We may well only have another 5% or so upside before a good sized 20-30% correction. That is what I am anticipating, and it should factor into the risk vs. reward of any strategy going forward.

Friday, October 4, 2013

S+P 500 finishes little changed on week as reality of Government shutdown is realized...

 
In a week that featured a fair amount of intraday volatility due to headline news of the reality of the Government shutdown, the S+P 500 actually closed the week relatively unchanged, with the NASDAQ actually closing at a new bull market high. So as the "news and the noise" abounded, in terms of price action it was much to do about nothing.
 
In last week's post we talked about a key support area at 1685-1687 as defined by the May highs and Syria breakaway gap. Due to the anticipation of a government shutdown we found ourselves opening below that area on Monday's day session, a bearish implication for the short term trader's time frame. However I want to point out the fact that responsive buyers showed up almost all week, with the exception of Thursday.
 
 
This chart above is a 30 minute chart of the SPY (S+P 500 Index Fund). What I mean by responsive buying is the fact that 4 out of the 5 days this week the market closed well above it's open call. Say what you will, but this looks to me like demand still remains.
 
 
Now the real question is, where do we go from here? On the short term, personally I believe we are preparing to push higher to retest 1709 which is defined by the August highs and 61% retrace level of this current correction. I am using that level as my short term bull/bear line in the sand. Strength above (meaning a close above or continued price acceptance above) signals to me a high probability that the drop is over and we should see a market rally to at least 1775 on the S+P 500 and around 16,500 on the Dow. (Upside targets are explained in this post.)
 
However until/unless this occurs I am preparing for the possibility of some further short term downside. The chart above is a daily chart of the S+P 500 highlighting the 1640 level, as this would about match the size of the drop (82.20 points) that occurred after the August high.
 
 
However the main reason I am focused on the 1640 area is the low that occurred on September 6th of this year. The 5 minute chart above shows that days price action and how the low was formed. The story behind this short term volatility is described by Briefing.com:
 
"The retreat coincided with headlines from the G-20 Summit in Russia where Russian President Vladimir Putin said his country will assist Syria if an external attack occurs."
 
This low was completely reversed in a short amount of time, but the market has a history of needing to retest and even briefly take out lows such as these before it can proceed higher. Those of you who follow market profile and auction market theory will understand exactly what I mean.
 

However I still feel the need to show recent price action that hopefully explains the point I am attempting to get across. This 5 minute chart above shows a trading session that produced a similar sharp and fast volatile move. This day happened to be April 23rd of this year and the story behind this intra-day move is also explained best by Briefing.com:
 
"The rapid decline occurred after the Associated Press Twitter account was hacked and false reports of an explosion at the White House surfaced on the site. The Associated Press has since acknowledged the security breach and the White House has issued a statement saying "the president is fine.""
 
The intra-day low came in at 1563.03.
 

Now let's fast forward two months later, the market was showing some short term weakness after it's May high. But as it turned out, all it was attempting to do was retest that low that was quickly left behind. It took a quick "peek" below and apparently there was very little interest and the market never looked back from there.

Of course there are many examples of similar price action. I've pointed out the most recent to express my point. Any weakness below 1670, which is this week's low, I have to believe the high probability then becomes a need to test that 1640 area before proceeding higher. I strongly believe that if this scenario materializes that 1640 will likely cap any further downside in the equity markets.


Taking a quick look at the cumulative advance - decline line I am seeing some potential signs of internal strength. As this reading is outperforming the broader market. Of course this really doesn't mean much until we can break above what has now become a "triple top" around the 37,000 level.

In conclusion: In the short term it appears there is some downside risk remaining. However whether this week's low becomes THE low or we need to push lower to 1640, the Intermediate and Long Term trends remain upward and I believe this should carry us to at least 1775 on the S+P 500 and 16,500 on the Dow over the coming months.

However in fairness we need to keep in mind the fact that this bull market, by historical standards, may be getting old. The risk to reward at current levels is not as favorable as that was present in 2011. I say that to get across the point that any real signs of weakness at these levels going forward, really needs to be taken seriously.

It is my humble opinion that any significant correction of 20-30% will not occur until our upside targets are met. However the market could care less about any one's opinions, so proceed with caution!