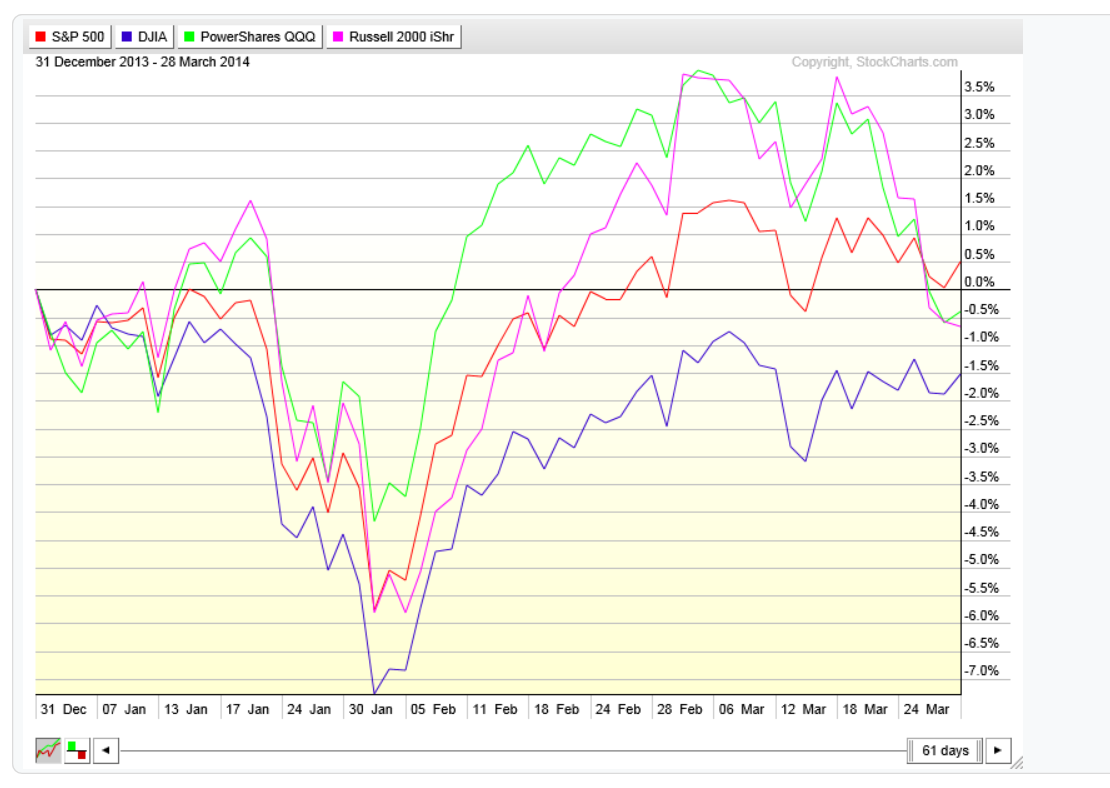
So far in 2014, market returns on the equity side of the allocation have been hard to come by. After 61 trading days for the year 2014, only the S+P 500 is showing a slight gain (below 1%). The Dow, Nasdaq and Russell 2000 (small caps) are all in negative territory year to date, although not by much.
Let's rewind to year 2013 and we see that the first 61 days last year proved to be much better for equities. At this point last year, three out of the four major averages were sporting double digit returns already.
In January of this year the S+P 500 matched it's biggest correction of 2013 before rebounding and making another all time high. The market is currently stuck between a range defined by 1840-1880 swing high/low pivots. However even with all the recent volatility the S+P 500 remains only 1.5% off it's all time highs.
This 60 minute chart above shows this recent trading a little more closely. A break below 1840 sets up the expectations for a drop to at least 1809-1799, the zone that is marked on this chart above. Of course a break above would likely setup the expectations for a rally to new highs to 1940 or so.
The Dow Jones average has been in negative territory all year after hitting long term resistance projected in the pattern we defined going back to last year. The Dow started off the year by matching and slightly exceeding it's biggest correction size of 2013 before rebounding. Unlike the S+P 500 it failed to make new highs on the rally and now sits inside a similar trading range to the S+P 500.
The Nasdaq also matched its biggest correction of 2013 during the January drop. However more recently we have seen more weakness in the small caps and the tech heavy NASDAQ. While the S+P and Dow continue it's trading ranges the Nasdaq and Russell have actually broken down a bit. The Nasdaq is 5.5% off it's highs as of Friday's close.
The Russell 2000 is also 5% off it's highs and has made a recent lower low as it dips below it's 50 day moving average. The Nasdaq and Russell still remain in bullish up trends however this weakness is worth noting as it signals a possible reduction is risk taking.
The market internals still look strong as both the New York Stock Exchange and the S+P 500 advance - decline lines remain in solid positive territory year to date.
New 52 week highs on the New York Stock Exchange are in short term oversold territory as the bearish divergence continues.
Another bearish divergence can be found when looking at the spread between high yield bonds to treasury bonds. A higher reading means investors are more willing to buy higher yielding (riskier) bonds in place of (safer) treasury bonds.
Sector performance year to date shows Utilities taking the clear number one spot, showing returns of 9%. Health care has been under pressure of late due to the recent volatility in Biotech, which now makes up almost 20% of the sector. Cyclicals, 2013's best performing sector, comes in as the biggest under performer as of Friday's close.
Asset performance year to date continues to show relative strength in Treasury's and Gold, while emerging markets is starting to show some life but still comes in as the laggard year to date so far.
The trend matrix continues in it's bullish theme, although slightly less bullish than it was two weeks ago. As the Nasdaq 100 (QQQ) small caps (IWM) and Consumer Discretionary (XLY) sector turn from a Bullish to Neutral trend reading. This is not a market timing tool but rather a gauge of the direction of the dominant trend and the strength thereof.
Another indicator I follow is how many stocks in the S+P 500 are in bear market territory. I use stocks trading below 20% from it's 52 week high as my criteria. Last week the reading came in as 6% of S+P 500 stocks in bear market territory. As of Friday's close that number has now gone up to 7%. Still far from danger territory but worth watching nonetheless.
In conclusion, I am still concerned with the potential downside risks in equities over the short term. However with all four of the major averages in up trends above their 50 and 200 day moving averages and the market internal readings as strong as ever, there is absolutely no reason to jump the gun and start crying market top. Investors expecting 2013 type returns from equities may very well be dissapointed, but that doesn't mean we can't get a 10-15% return in equities by year's end. All it proves is the importance of diversification among asset classes. Those investors that chose to re-balance their portfolios by rotating some of their stock earnings into their bond allocation have been rewarded.


