Saturday, September 28, 2013

Stock Market Update: S+P 500 hits support, sector performance, market internals and more...


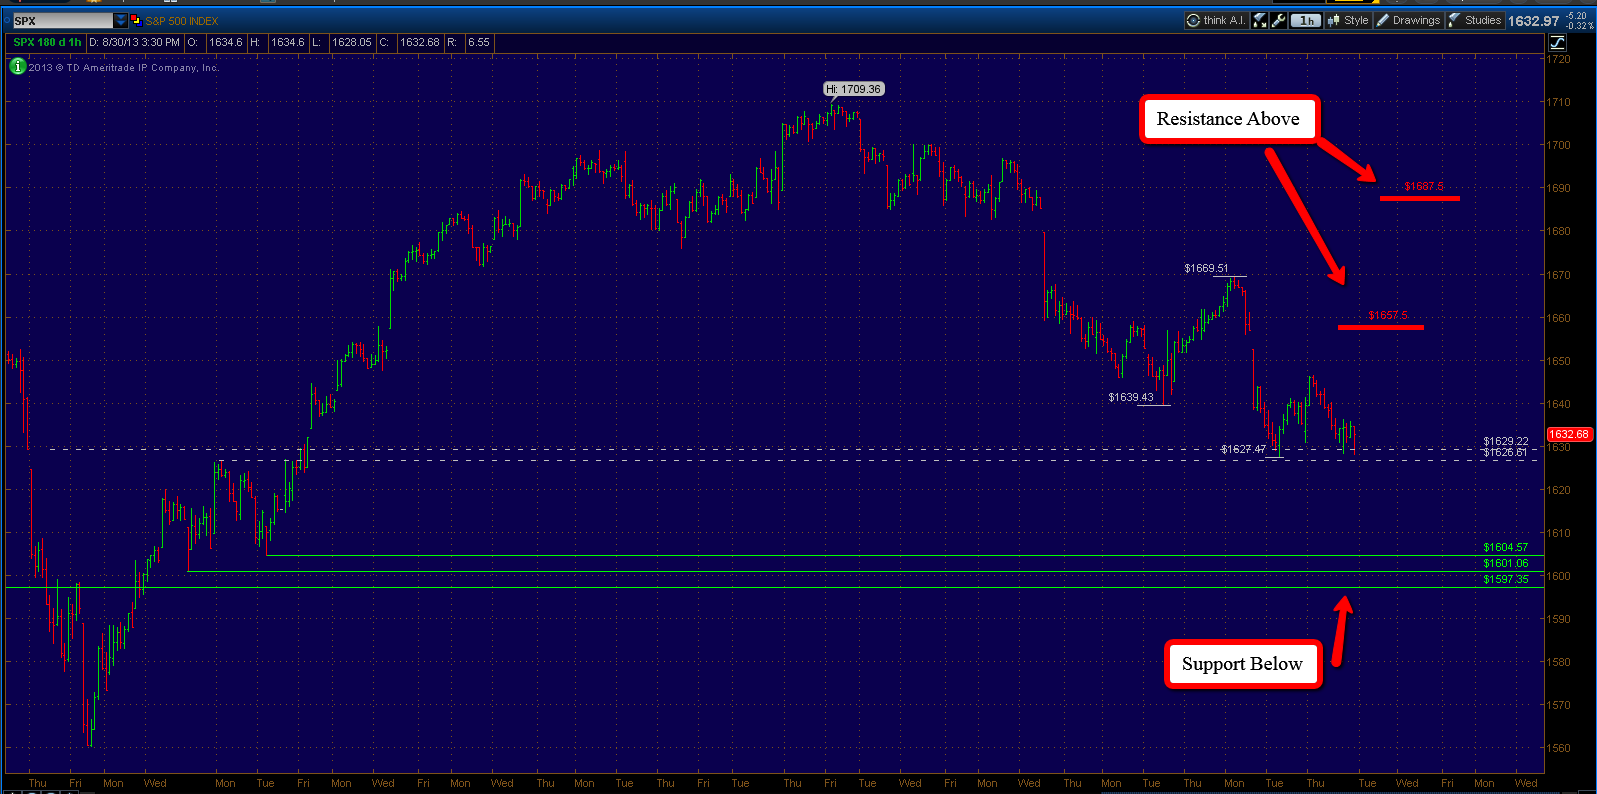
With this week's sell off the S+P 500 has come into support as identified on the chart above. This support zone was referenced in last week's update at 1685-1687 as defined by the May 22nd high along with the August 14th breakaway gap down on the initial news from the Syria situation that sent the market into a brief tailspin.

I am looking at this level very closely next week as a failure here would send us back down to the 1640 low on the chart above, this was a low that formed very quickly off of some news out of Russia regarding the Syria situation also. This level was immediately rejected then but any further weakness next week would signal to me that this low would need to be retested before a sustainable move higher could proceed.

I am expecting another push higher to at least the 1775 level (reason explained in this prior post) once support is established and before all is said and done.

It is also important to point out the fact that this current bull market off the 2009 lows is indeed getting pretty old by historical standards. This means that any real signs of internal weakness should be taken seriously as risk/reward is not as favorable as it was in 2011 and 2012 when I made this statement.


Let's take a second to look at the sector performance year to date in the above graph. Services (Consumer Discretionary), Healthcare and Industrials are our relative outperformers.


Consumer discretionary chart above reveals continued strength as it continues to make higher highs with the S+P 500 and trades above it's rising 50 and 200 day moving averages.


Health care sector shows the same underlying continued strength with higher highs and above 50 and 200 day moving averages.


Industrials also show the same bullish picture, trading well above it's August highs and moving averages.


There is a lot of talk of some potential head and shoulders pattern brewing in the financials, frankly I do not see it. While it is true the financial sector failed to make new highs with the major averages, this graph above still shows performance in line with the S+P 500 since the August 27th low at 1627 in the S+P 500. So I think any talk of a reversal in trend based on that one factor alone is jumping the gun to say the least.


Taking another weekly look at the market internals in the form of the advance-decline line of the New York Stock exchange we can see the stall at the May and August high prints. As I have stated on numerous times, we need to see a break above to keep this trend up alive. This week I am seeing some potential strength brewing beneath the surface as this reading still close to it's all time highs even though the S+P 500 has pulled back a good 3% from it's highs. As always we will have to keep a close eye on this reading the next few months.


This weeks economic data will be focused on Friday's unemployment report. But of course the main event will key on the gridlock in Washington and the debate regarding the debt ceiling. I suspect we won't see a meaningful rally until some kind of resolution, albeit short term, is achieved. There is sure to be some short term volatility in between.

Saturday, September 21, 2013

Stock Market Update: Fed stays the course...


To the surprise of most, on Wednesday the Federal Reserve decided to continue it's quantitative easing program in full with zero reductions in asset purchases. In hindsight I guess this could have been foreseen, since unemployment still remains above the 6.5% threshold and with inflation below. CNBC has more in depth analysis.

The charts above highlight the typical "QE" pattern. After the initial jump in the markets after each of the QE announcements, the following day became a sell the news event. Typically retracing all the gains made the day of the announcement, and in the case of QE 3, it kicked off what became close to a 10% pullback.

I bring this up not to scare you, but to show how buying the initial announcement can be risky. And also to point out that it is not unusual for the markets to retrace all the gains of a major Fed announcement.


The S+P 500 had come into some short term resistance around 1730-31 which is defined by the length each swing high put in above the previous.


Now we find ourselves in a pullback in search for support below. I see the 1709 level as good support, it defines the August 2nd top and also matches the size of the biggest correction (21 pts.) off the rally from the low a few weeks ago at 1626. We reached that level on Friday just before the close. The next major support level below comes in around 1685, as defined by the breakaway gap left behind during the initial concerns over the Syria situation.

As long as we hold these above levels, I believe the market will reach the upside targets in the Dow and the S+P 500 (16,600 and 1775 respectively).


The NYAD continues to stall out around the 36k level. We really need to see a clean break above to see any continued strength in the major averages.


This week for economic data the focus will be more on the Eurozone, as Sunday the German Federal Elections will be held, bookended by ECB president speeches.

Saturday, September 14, 2013

Stock Market Update: Strong weekly finish by the major averages...

 
The major market averages (Dow, S+P 500) finished off a strong week with closes both above their respected 50 day moving averages and their 61% retrace levels from the August 2nd highs. In most cases this means that the correction is over and the swing low is in. Given this information, let's take a look at some likely upside targets.
 
 
The SP 500 reached our second upside target/resistance level mentioned last week at 1687.50. As you can see on the chart above, the S+P has rallied 150 points off each of it's swing lows going all the way back to the beginning of the year. This gives us a next target of 1777.47 on the upside. This will become an interesting area as there is some important confluence which I will show later in the post.
 
 
The rallies in the Dow have also been similar, measuring roughly 1100 points in length. The Dow has underperformed during this last correction and in turn it's upside target comes in at 15,857.75.
 
 
So as the short term trends turn upward I think it is imperative and prudent to also look closely at the risks involved. This coming week the economic calendar becomes very important, as on Wednesday the Federal Reserve will gives it's FOMC Statement with a press conference afterwards. There has been a lot of speculation and anticipation about what the Fed will do with it's current Quantitative Easing 3 (QE 3) program. The markets reaction following this statement will likely be very important to the short term trend. A bad reaction could have us drop back to 1600 before we rally back to the upside targets. A good reaction pretty much ensures upside targets will be hit over the coming months.
 
Personally I have no idea what the Fed will do or how the markets will react. If I had to guess I would say that they will pull back (sick of hearing the word "Taper") on some amount of the Bond buying program, for good reasons. The markets demand for "safe" assets has subsided (Gold, Bonds) and in turn there is no need to continue status quo.
 
 
So we have the near term headline risks of Fed "Tapering", European elections, debt ceiling debates and the eventual appointment of a new Federal reserve chairman. We also have the risks of a Bull market that is nearing it's conclusion. While I highly doubt I will ever see the March 2009 lows ever broken in my lifetime, or a stock market crash of the likes of 2008. It is likely however that we see a good 20%-30% drop in the major averages sometime in the next 3-12 months.
 
The chart above highlights the fact that we are nearing a potential upside target in both time and price. This is calculated by taking the price and time of the S+P 500 from it's March 2009 lows to it's May 2011 highs. This was followed by a 19% market correction during the US debt downgrade and Euro instability. While a 19% drop does not constitute a bear market, the Dow actually did drop 21%, which according to the definition, does equal a bear market drop.
 
These price and time levels will be reached in the week of November 25th around 1778 on the S+P 500. Which comes in around the same level as the short term upside target mentioned in the beginning of the post.
 
 
Let's also go back to this post in July. This chart above is the long term time and price trend of the Dow, this chart gives us a caution sign roughly around the 1st quarter of 2014 around 16,500 on the Dow.
 

Now those patterns alone doesn't mean that the market has to stop and reverse at exactly that time and exactly that price, it is purely a blue print with some high probabilities. But in all actuality the market can and will do whatever it wants to. However along with the aforementioned patterns we see a cumulative advance - decline that continues to show weakness and bearish divergences. What I mean by this is, if you look at the chart above you see as the S+P 500 has made higher highs, the advancing issues on the NYSE have failed to make new highs alongside. In fact, now we have as the S+P 500 is only about 1% from it's all time highs, the advancing issues are only roughly at the midpoint from the August highs to lows.

Now these divergences can go on for awhile and should not be used as a timing tool, but these type of divergences are typically seen before the ending of bull markets. It means fewer and fewer stocks are participating in these advances, and that type of price action simply can not go on forever. Therefore it is important, in assessing risk to reward potential, to pay attention to all of these patterns I have mentioned above.
 
So in conclusion, what I am trying to accomplish here is to point out the high probability risks and rewards in this current market environment. Readers than can assess their own situation and make their own decisions accordingly. I have given my opinions but also steered clear of giving "set in stone" predictions and forecasts, which as we all know are nothing more than educated guesses.

Saturday, September 7, 2013

Stock Market Update: Retracement rally.... now what?

 
In our last post we talked about the potential for a retracement rally, citing some strength in the advance - decline line coupled with the fact we happened to be at some strong short term support levels. This week we got the retracement rally we were looking for, right into the upside target/resistance level mentioned in the prior post, at 1657.50 as noted on the 60 minute chart above.
 
One pattern of note that since the low at 1626 the S+P 500 has seen three short term drops of 18-20 points in length, including the most recent drop on Friday morning. This for me says support should come around 1643.50 below. If the market should spend much time below and especially if it closes below this level I would say the odds are high that the previous low at 1626 will not hold.
 
Friday's price action to me was bearish for the short term. In my opinion the actual jobs number was potentially the worst of the outcomes, as it was weaker than forecasts but still not nearly weak enough to definitively sway central bankers from "tapering" it's bond buying program. In turn the market traded above our resistance level at 1657.50 but could not close above it.
 
I am going to use this level in judging next week's price action. A close above would signal to me that we are likely headed to the next upside target/resistance level coming in at 1687.50. However any continued weakness on Monday and especially weakness that produces a close below 1643.50, would have me looking for new lows below 1626.
 
 
Where might this new low come in at? Well the chart of the Dow Jones Industrial Average above shows the relative underperformance compared to the S+P. The Dow has now almost corrected as much as it had during the correction off the May 22nd high. That level is marked on the chart above coming in at 14,664.62. There is also the last swing low at 14,550 that I would not be surprised to see a test below there before reversing back upwards.


In the S+P 500 we can calculate a potential area around 1615. As each of the last two swing lows has been roughly 12 points lower which equates to 1615 on the downside. There is a much better support zone "cluster" coming in around 1600, give or take a couple points, for a variety of different reasons I have pointed out in prior posts. I am anticipating that any further weakness in the broader market would stop there and the next major move higher would begin.
 

Taking an updated look at the NYSE advance - decline line, it continues to show relative weakness overall. This is not a great sign for the broader markets as it shows lack of participation in the advances. I continue to monitor this as a drop below the 24,000 low would have very bearish implications.


The economic calendar this week is relatively light. Friday shapes up to be the biggest day for potential market moving economic data. All eyes will be on the following week as the Federal Reserve and it's latest FOMC statement.

Sector performance for this week actually shows some risk acceptance as Financials, Basic Materials and Tech outperform while Utilities, Health Care and Consumer Goods round the bottom of the list.

In conclusion: So far the bulls have failed to flip the short term trend back to the upside. I would remain relatively neutral on the short term direction until we get price acceptance either above resistance or below the support level mentioned (1657.50 + 1643.50). This week was week five of the correction and as we saw in last week's post, that since 2011 every correction in the Dow has lasted 5-6 weeks in length. So needless to say I am expecting a bottom soon if we haven't already.

Monday, September 2, 2013

Market Update: Short term S+P 500, Oil and Gold...


As the short term trend in the major averages remains downward. The S+P 500 now finds itself in what I believe is a strong short term support level. This is defined in the chart above by the 1626 settlement price that preceded one of the worst days of the year for stocks. Along with a previous swing high left behind in this most recent uptrend. I believe this support zone will prove to be strong enough for at least a retracement rally.

Going forward I now see resistance as marked on the above chart at 1657.50. Any further strength I would expect to see 1687.50 as the next logical upside target. Any continued weakness below this most current 1627 low would signal a drop into what I believe to be stronger support around the 1597.35 - 1604.50 zone. I am not anticipating this correction to yield much more than this to the downside and still feel that the S+P 500 will trade above 1750 over the next few months. However I do see some technical weakness in the advance - decline line which I have noted for awhile now.


Oil has hit our last upside target! In this post back in July I laid out a couple upside targets for Oil and last week we hit the last upside target and sub sequentially called at least a short term top in prices. Any further weakness could have us dropping back into the $98 level which happened to be the top of the last trading range.


Another upside target nearly hit. This time in Gold, using the GLD which is the ticker symbol for the iShares Gold trust etf. It stopped a little short of the mark as it hit one of the previous major swing highs. I would expect to see support now stand in the $130 level and the next move higher to push above the $143.43 high left behind in April of this year.


The advance - decline line is showing some glimmers of strength here. As the S+P 500 made new lows last week, this indicator actually made a higher low. Judging by this I believe it is possible that we can see a retrace rally that is bigger in size than any of the previous we have had since the August 2nd high. That is where the 1687.50 level would come into play.


With a holiday shortened week we still have some important economic data for the markets to digest. We have some central bank policy statements and press conferences from both the BoJ (Japan) and the ECB (Europe). I believe most notable for domestic data will come on Friday, as the monthly employment data is released. This may become very important to traders as it could sway the policy decision by the Fed when it holds it's own statement and press conference in two weeks.