Sunday, June 28, 2009

Where is Oil and Gold Going?


Where is gold and oil headed? I am asked that question many times so I figured I would post my opinion on this issue. First off I want to say I am long term bullish on all commodities with some type of inflation on its way in say the next 18 - 24 months.

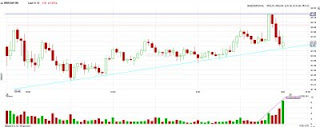
For the short term however in oil I am bearish, here it is top chart is a daily on oil, check out the long term rising trendline from the Feb lows. There is also a more steeper trendline formed that I didnt draw since May. However steeper trendlines dont seem to hold up as well. Then you see what I believe is a head and shoulders pattern that has formed the last couple of weeks, I expect to see a little more upside to complete the right shoulder if any, then a descent to test the horizontal support at approximately the $67. If it breaks next lower target is $58 which would be the rising trendline support off the Feb lows. At that level I think it would be an excellent play to the upside, whether you trade USO, DIG, DUG. Again I see oil trading in the $55 to $80 range for some time.

Next we turn our attention to Gold (Second Chart), I have been paying a lot of attention to it, I had taken a position in GLD a few weeks ago and played it up all the way to the horizontal resistance bar. Here is an inverted head and shoulders pattern on the weekly chart playing out over the last year or so. Watch that $1000 - $1050 level very carefully. If we do break that we are going MUCH higher, my target would be around the $1350 level! I do think that will happen in the near future the only thing that concerns me is the MACD indicator which has made a consective lower highs which is bearish. But I believe that it is only a consildation move to build enough momentum to finally take out that longterm resistance level and when it does watch out! Best way to play that breakout would be GLD on my opinion.

Weekend Update: Sector Performance


Here is a sector performance bar chart I like to take a look at from time to time. What you see here (Bottom chart - sorry having some problems with this uploading stuff) is the 9 different sectors in the S + P 500 and the actual performance on the SPX index itself. As you can see the best performing sector for the month is the Tech sector, the Nasdaq and the tech stocks like Google, Bidu, Rimm and Apple have been the leading factors in this rally off the March lows. You also see Health Care and Utilities leading as well. These sectors are defensive sectors, where as the financials, energy, and such are more aggresive offensive plays. The reason I say this is now look at the very same chart setup (top chart) but the date ranges are different. I will use the sector performance chart for the last 10 days....

Here we see clearly that the Health care, Utilities and Consumer Staples sectors have outpreformed the market. And the financials, technolgy and definitly energy sectors have underpreformed.

Why is this important? Well when you start to see the money flowing into these defensive sectors and out of the offensive sectors you can clearly tell that a pullback is underway or in the works. And vice versa when you start to see the sector rotation favor the offensive sectors it would be wise to trade for the upside potential. Sounds easy but it is still very important to recognize these patterns so we can stay on the right side. Because the bottom line is out of 100% of the money flowing into the market it is only probably 25% of the "big boys" money that actually move the market. Follow where the big money is going, be smart and do your homework, probably the best advice I can give especially for a new trader.

Friday, June 26, 2009

EOD Wrapup: Tread lightly, pivotal point for the market!


Well our scenario number 1 is still alive and well, the high of the day was 922 SPX, a level I have been saying to watch closely. This market is obvously trying to shake out the weak money and burn both bulls and bears alltogether.


Thus the title of my post "TREAD LIGHTLY" if you don't have any positions, keep it that way. If you do hold and watch the 920 - 930 level until that is broken one way or the other stay the heck out. I have my SPY puts I bought some more at the close to keep my cost basis down. No futures for me yet until I see a more desicive move one way or the other.


My bias is still to the down side, I believe that we SHOULD (emphasis SHOULD) gap down on Monday and sell off should steadily continue into Tuesday and possibly Wednesday. BUT, unless I see a high volume rejection of prices at these key levels nothing more will I do. As the title states, at a pivotal time right now if we break 930 SPX with good volume we will continue on much higher. My first guess without having to really study the charts today is the 970 - 980 may be the next stop.


First chart is the daily chart I put together real quick, still having major computer issues and haven't had time to put together some serious charts. But this will give you a picture, we had approximately a 9 point range today which is really weak, volume was relatively weak as well, problem is there could be an argument for both sides using these numbers. Low volume could be bullish and that this is only consolidation for the next move up. Stochastic cross is bullish, MACD is looking like it is curling up, so you can make an argument for both sides.

Second chart is the 5 min chart of todays action only, check the high volume spike in the last 15 min (purple line). But still couldn't come near to breaking our high target and actually sold off and ended the day in the red.

Overall this is a tough time to be trading, I will do some more research this weekend at the market internals and different sectors and see if I can come up with some more evidence to support my sell off scenario.


Have a great weekend all!

Wednesday, June 24, 2009

EOD Wrapup!


Well as expected FOMC announcement was a non event, the market actually sold off a bit but managed to rally into the close.

I mentioned the 904 level on ES where I was going to take a short position, now look at the chart of ES the top tick was 906.50 I believe and sold off from there. Could have banked some serious coin, but the tape looked very bullish and my computer is STILL giving me problems, I played it on the safe side. As stated in one of my favorite movies "Rounders" Matt Damon said "You can't lose what you don't throw in the middle" so true Matt!

Here is the charts, first is SPX daily, if you can see I marked what I believe what will play out in the short term. This price pattern is called a head and shoulders pattern. (RS) which is short for right shoulder comes in at the 925ish level, (H) which is the head is the top at 956.

What I believe the market will do is rally back up to the 20 ma (moving average) which is conveniently at the 925ish level, perfect for developing a right shoulder. Now this is a bearish reversal pattern, so if I am right I am going to look to LOAD up on the short side around 925ish and ride it all the way down.

We should make it down to the 880 level which is the neck line, if we break that the pattern is confirmed in which case a move down to the low 800's is the most logical target.

On the 60 min chart you can see it a little more clearly with 880 and 925 being the pivot points to be respected.

I will post a little more about indicators that you see on these charts (RSI, Stochastics, MACD) sometime in the future for now, just remember the pivots.

Lastly, I will do a post on what I will believe the market will play out over the summer and into the fall. This head and shoulders pattern is just a small pattern in a bigger move, if that makes sense. Everyone have a good night!