Saturday, November 23, 2013

Stock Market Summary: Dow above 16,000 and S+P 500 above 1800 to end the week...


The S+P 500 and the Dow both closed the week at new all time highs. 1775 in the S+P 500 was key and it reacted very well. The next measured move upside target will now take the S+P 500 up to 1833 in the near term. In the long term I still maintain the market is getting quite overextended but another 3-4% upside is realistic.


The Volatility Index (VIX) remains very low, each time this year that the VIX hit 20 it became a reliable buy signal. A VIX below 20 generally suggests that pullbacks are short lived and shallow, more of the 4-5% variety, which is what we have seen.


The cumulative advance - decline line continues to show bearish divergences. This indicator has not moved much higher since the May highs meanwhile the S+P 500 is roughly 6% higher above it's May high. This means the advance has been occurring with fewer participants and is usually a precursor to a significant correction. However this is not a timing tool and these divergences to go on for awhile before it eventually settles itself out.


Three of the nine sectors within the S+P 500 also made new highs on the year. Those being Financials, Energy and Health Care.

 
Year to date relative strength in this market comes from Health Care, Discretionary, Industrials and Financials. Underperformance comes from Materials, Tech and Utilities.
 
 
The US Dollar continues to find support around the $79 level, it's year to date performance has been roughly flat. I am watching the lows at $79 going forward, as the last time we had a significant drop in the Dollar, it eventually put downward pressure on equities in 2011.
 
 
TLT (Bonds) found support again at $102 this week. Upside resistance now stands at $111.50 and $118 as denoted on the chart. Next support level below comes in around $96-$97. At that point it would about match the size of the drop during the 2009-2010 correction, which happened to be the biggest correction seen since TLT was introduced.
 
TLT would need to find support there or $87 will eventually get taken out afterwards.
 

The yield on the ten year continues to hold above 2.5% after nearing the 3% area. It has completed a correction about the size of the one that took place early this year. The next upside comes in at 3.35% and downside support stands at 2.25%.


In conclusion, a look at year to date performance among asset classes. Obviously it's been a tremendous year for equities with Small Caps and Large Cap Tech leading the way with above 24% returns. Emerging markets are the laggards, with growth and "Taper" worries weighing heavily.

Wednesday, November 20, 2013

Stock Market Update: 1775 in the S+P is Key...


This week we saw a key psychological level in both the S+P 500 (1,800) and the Dow (16,000) get tested for the first time. So far it has proved to be short term resistance. The 60 minute chart above shows the recent price action.

After reaching 1775 we created a short term trading range of 29 points that formed an inverted head and shoulders pattern. This week we narrowly missed the upside target of that pattern at 1804 with a high of 1802.33. Downside support now stands between 1775 and 1773 as previous swing high and low pivots that would match the size of the biggest sell off since the lows of 1646 were formed last month.

Any continued weakness below support would break the rhythm of the market and possibly signal a change in trend. Given the technical structure of this current market and the potential of it being overextended I believe any such weakness should be taken seriously at this stage of the game.

Tesla (TSLA) Price Chart Update...


Tesla continues to trade lower in search of buyers, many are saying the momentum in the stock is broken. In terms of the short term trend they are correct. I think we have done a pretty good job of staying in front of this stock in terms of technical. We pointed out a couple weeks back that $180 was going to be resistance pre-earnings and how the failure below was likely to take the stock price closer to the $115 level. And so far that is exactly what is playing out. So now let's look at the big picture to see how this stock has reacted in the past.

This daily chart above shows price action off Tesla's IPO in 2010, into early 2013 just as the stock went parabolic. As we can see this stock is no stranger to volatility. Off of it's Initial Public Offering the stock proceeded to drop 50% from $30 to $15 dollars a share before finding support and making a new high.

Now each time the stock made a new high it proceeded to correct 42% the first time and 36% the second time. So basically once a year since it's inception this stock has experienced a significant correction. Quite typical for a new stock and a new technology working out the "bugs".


So now in light of that information, the current correction in Tesla doesn't look all that bad just yet. In this daily chart above we see the price action for 2013 and see we are clearly in our "once a year correction" mode.

From current lows from yesterday at $119 we have a 38% correction which is right in the sweet spot of the previous years drops. Coming into potential strong support below at $115 and then $104.50 with a 200 day moving average coming in around $108 as well.


Since this is quite a volatile stock the most prudent thing to do here may be to wait for buyers to show up again and ride the momentum back up. One thing I do to judge momentum is to measure the size of the retracement rallies and see if buyers can break the pattern of weakness.

So on the 60 minute chart above we can see the price action going back to the all time highs at $194. Each retracement rally has measured roughly 28 points in length. So if yesterday's low at $119 holds the next projected resistance would come in at $146.32 - $147.58.

If we can see continued strength above that resistance zone or if we make new lows, a greater than 28 point retracement rally off that low would be your first sign of potential change in the short term trend.

Saturday, November 9, 2013

A technical look at the major market averages, Cisco and Tesla...


All the major market averages remain in defined up trends. The S+P 500 along with the broader market suffered some higher than usual volatility on Thursday but finished the week strong on the back of a better than expected Non Farm Payroll report.

We have addressed the technical structure of the S+P 500 in the last post, last week and not much has changed since. As the chart above denotes, any potential further weakness in the near term should find support near the May highs at 1709 which from current highs would match the size of the last two corrections as well. Also last week we highlighted the fact that the upside target in the S+P 500 had been reached and that the next ultimate target really came down to the Dow from here on out.


Here's a look at the Dow chart, we can see how this latest consolidation phase taken place above the May highs along with the fact that this week we were able to close above each of the last three swing highs. It's really hard to get too near term bearish right now.


Here's is what may become the ultimate target for this bull market. This chart above shows trading in the Dow going all the way back to 1998. I've highlighted each bull market high point over the last 15+ years. You can see that each time the Dow got approximately 2400 points overextended above it's previous bull market top, the bull market ended.

Using this calculation we can project a potential bull market target of approximately 16,580 - 16,645. As further confluence we can see the last bull market lasted 5 years so March of 2014 would also match the time frame of the previous. Along with the fact the last two bull market highs came 7 years apart (2000,2007) another 7 years would also yield 2014.

Now the intentions are not to try to "pick a top" but rather highlight a historical pattern and heighten your alert if indeed we get some weakness off those levels. Also I am not in anyway saying a major crash will proceed either, I am very long term bullish and believe the markets are headed much much higher over time. Check out this post I created over the summer if you don't believe me.

However a good 20% correction from our target levels would healthy and in line with the historical market moves. This is the more likely scenario in my mind, I will certainly elaborate on specific downside targets if we see weakness setup. But for know there really is no reason to jump the gun and overthink things.


Let's take a look at the Russell 2000 in the above chart as that is what I believe was the key to market movement this week. I've highlighted the supply and demand pattern I can see develop since early this year. We have seen a series of rallies between 110-120 points and declines between 44-55 points.

That pattern came into play again this week as the Small caps have underperformed lately. We will see if this momentum can carry the broader market higher or will the S+P 500 drag it back to so it can find it's own support around the 1709 area we pointed out.


Taking a quick look at a couple stocks, Cisco (CSCO) has seemingly found support around $22 which was a prior pivot high and also nearly matched the drop the October highs to the low at $23.33 when taken from the last swing high at $24.80. Cisco has performed pretty well this week and the real test should come soon as resistance is near at $23.75. I believe a break above bodes well for shifting the short term trend back up again and making a run back to $26.


Sticking with Tesla (TSLA) from last week, we did a pretty good job of spotting resistance at $180. The high for the week ended up coming in at exactly $181.43 before falling after earnings were announced. Resistance now stands at $160 and as long as it stays below this stock is likely headed to support at $115 and possibly the 200 day moving average around $105.


Taking a look at the Advance - Decline line on the NYSE. We can see a clean "back and fill" reaction as it fell back to it's previous two highs for support.


Let's conclude with the relative performance by sector since the October 9th swing low was put in.

Friday, November 1, 2013

The Fed stays the course as S+P 500 price targets are reached (Apple, Tesla and Facebook price chart updates)


On Wednesday of this week the Federal Reserve announced it will continue it's bond buying program called QE 3 in full. This really didn't come as a surprise to anyone as the consensus view for tapering now seems to be March/April of 2014 at the earliest.

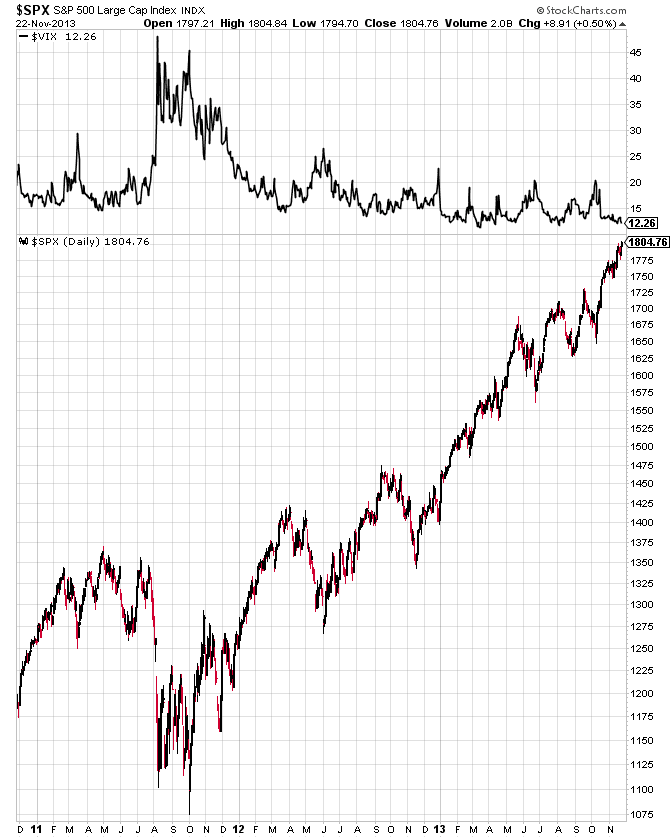
However more important to me was the fact that this Wednesday morning just before the FOMC statement was announced, the S+P 500 reached some major upside price targets. The chart above shows the third completed 150 point rally since April. The previous two swing highs eventually produced corrections of 80 and 120 points before proceeding.


Perhaps more important was a longer term upside target that was also reached this week. We have now effectively rallied as much as we did from 2009 to 2011 before the S+P 500 dropped 19% and the Dow dropped 21% during a US debt downgrade and Eurozone instability.


Now we must remember that these are upside targets first and foremost, or an area to take profits on long positions. And not an area to blindly get short 100% with all the leverage one can acquire. As with all things in investing it is all about managing risk. The prudent thing to do is take profits at upside targets and be cautious of any weakness shown after an upside target is reached.

This is exactly what I would recommend to all, any signs of continued weakness at these price levels now must be taken very seriously. I do not believe this is the time to have the "buy the dip" mentality unless you are skilled at short term trading and can have the discipline to use tight stops.

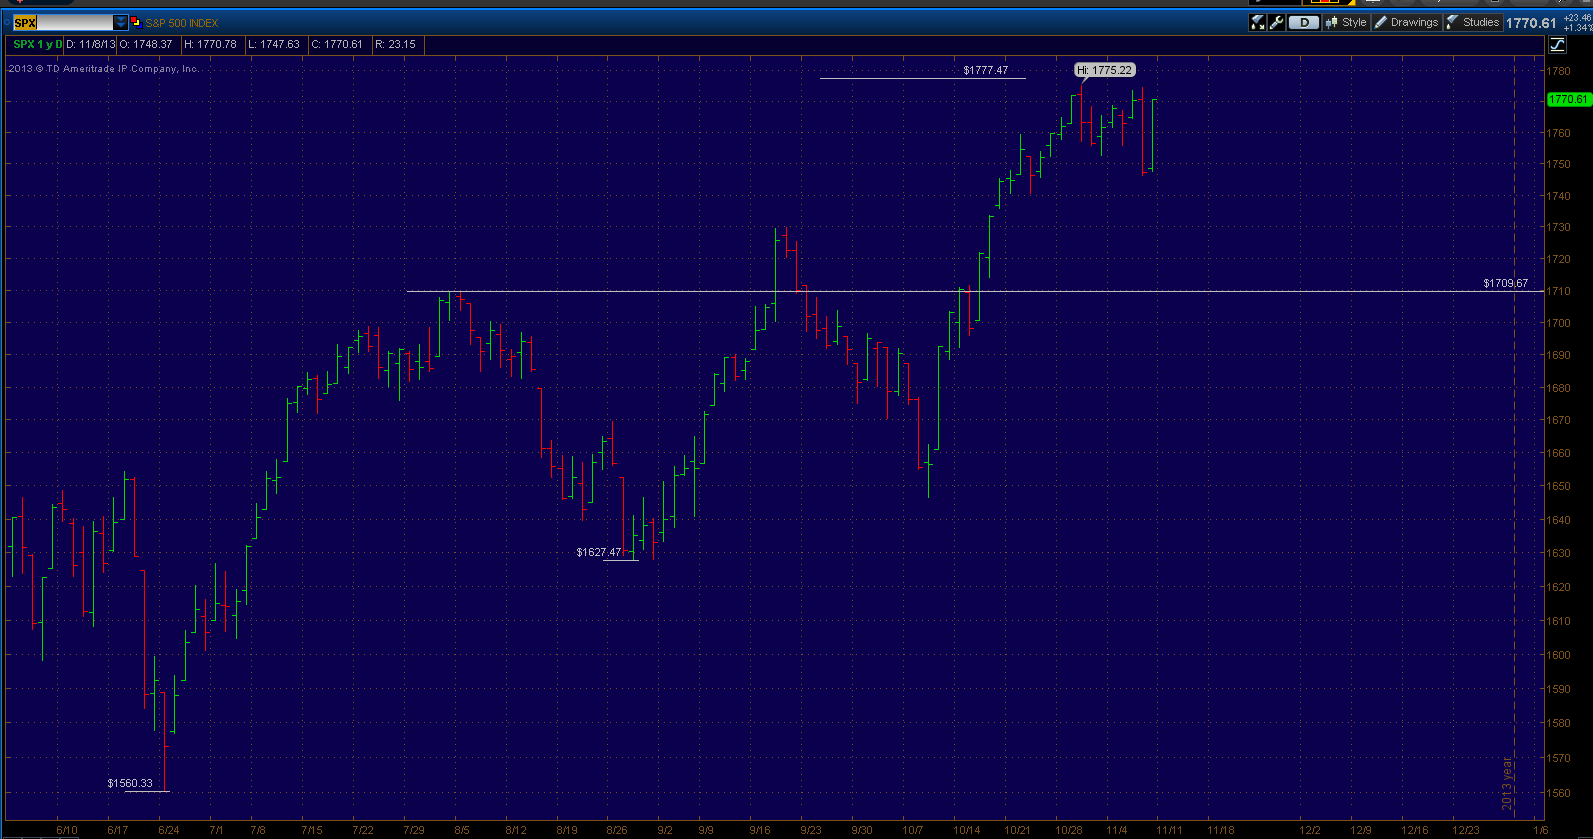
This chart above shows the short term trend of the S+P 500 to spot any potential signs of weakness. So far I do not see anything unusual, this week we had a 22pt or slightly above 1% correction which generally falls in line with the pattern since the low at 1646 was formed. I would advise using this week's low of 1752 as a measuring stick for next week. I believe any daily close below that would likely mean a drop back to the May highs at 1709 would proceed.

And if I saw continued weakness after that I believe that would signal that the 20-30% correction is indeed underway. The targets would be the QE 3 announcement high of 1474 and the 2011 high of 1370, at that point I believe it would be safe to get back in the water for the long term once again.

However like I said, until we see some selling pressure these are just hypothetical situations. But knowing where we are, in terms of being at or near the upper end of the trading range is crucial to making good investment decisions. You want to put yourself in the best positions to succeed in life and in the markets.


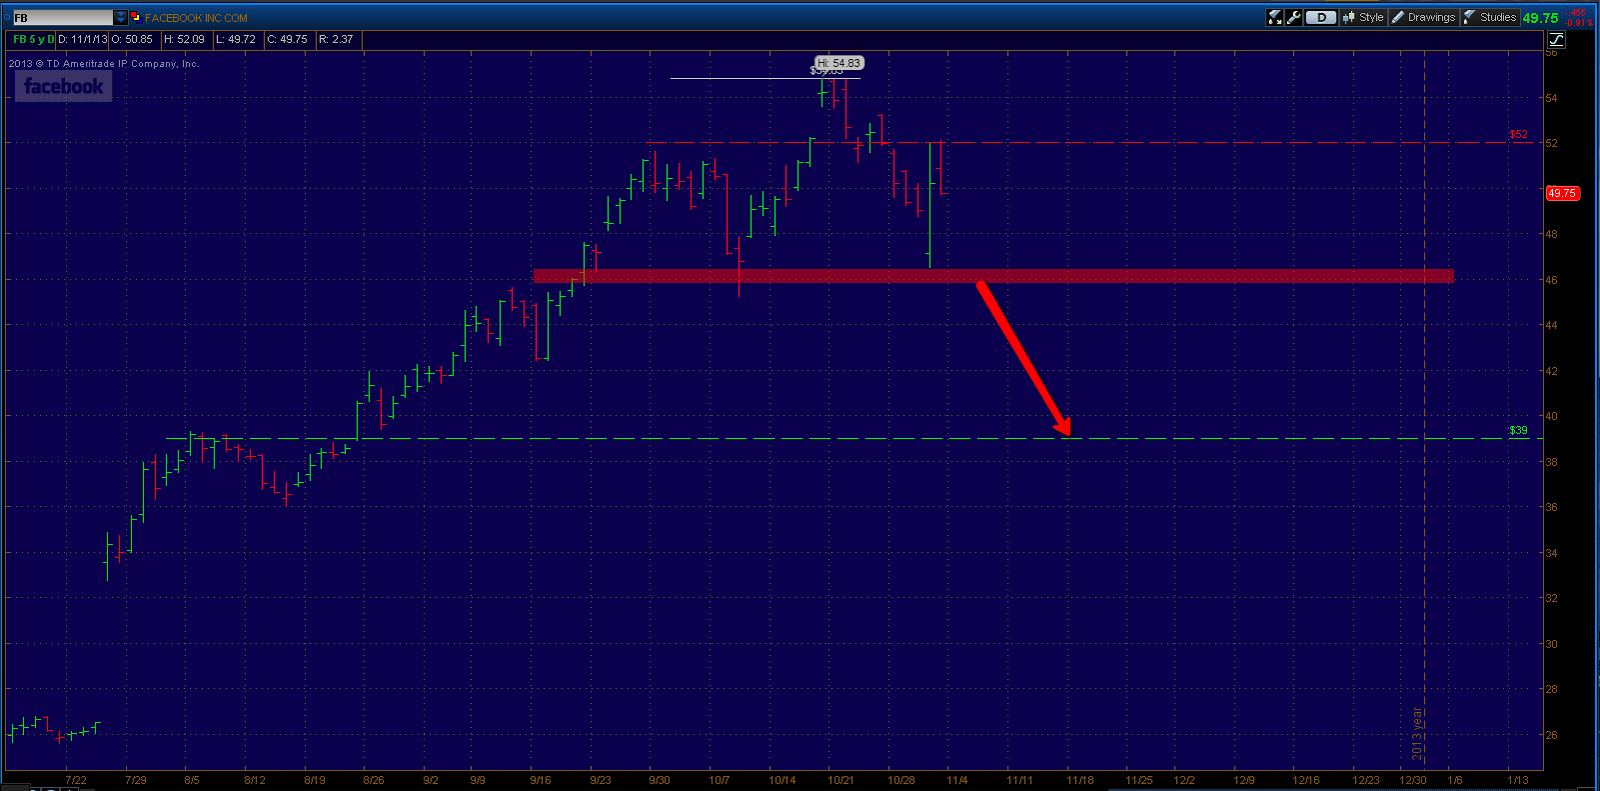
Let's wrap up by taking a look at a few price charts of popular stocks that also reported earnings this week. Facebook's chart is shown above, this chart goes all the way back to it's IPO in May of 2012. FB has really had a stellar year, after dropping roughly 50% after it's IPO, it has gained almost 100% year to date. I have highlighted the $45 dollar level as being key going forward, as it is both the high of it's IPO day and from current all time highs, would match the $10 correction that was seen earlier this year from the January highs to the June lows. This is crucial to hold going forward, as long as it can hold the stock should be poised to reach $60 and above.


On the flipside, $52 now looks like resistance for a potential head and shoulders pattern. Bulls really need to push prices above $52 in the near term along with defending $45. If they are unable to do that the result would be a drop down to $39 to follow. This still looks like a very good stock fundamentally and it may very well come down to what happens in the broader market that decides the near term fate.


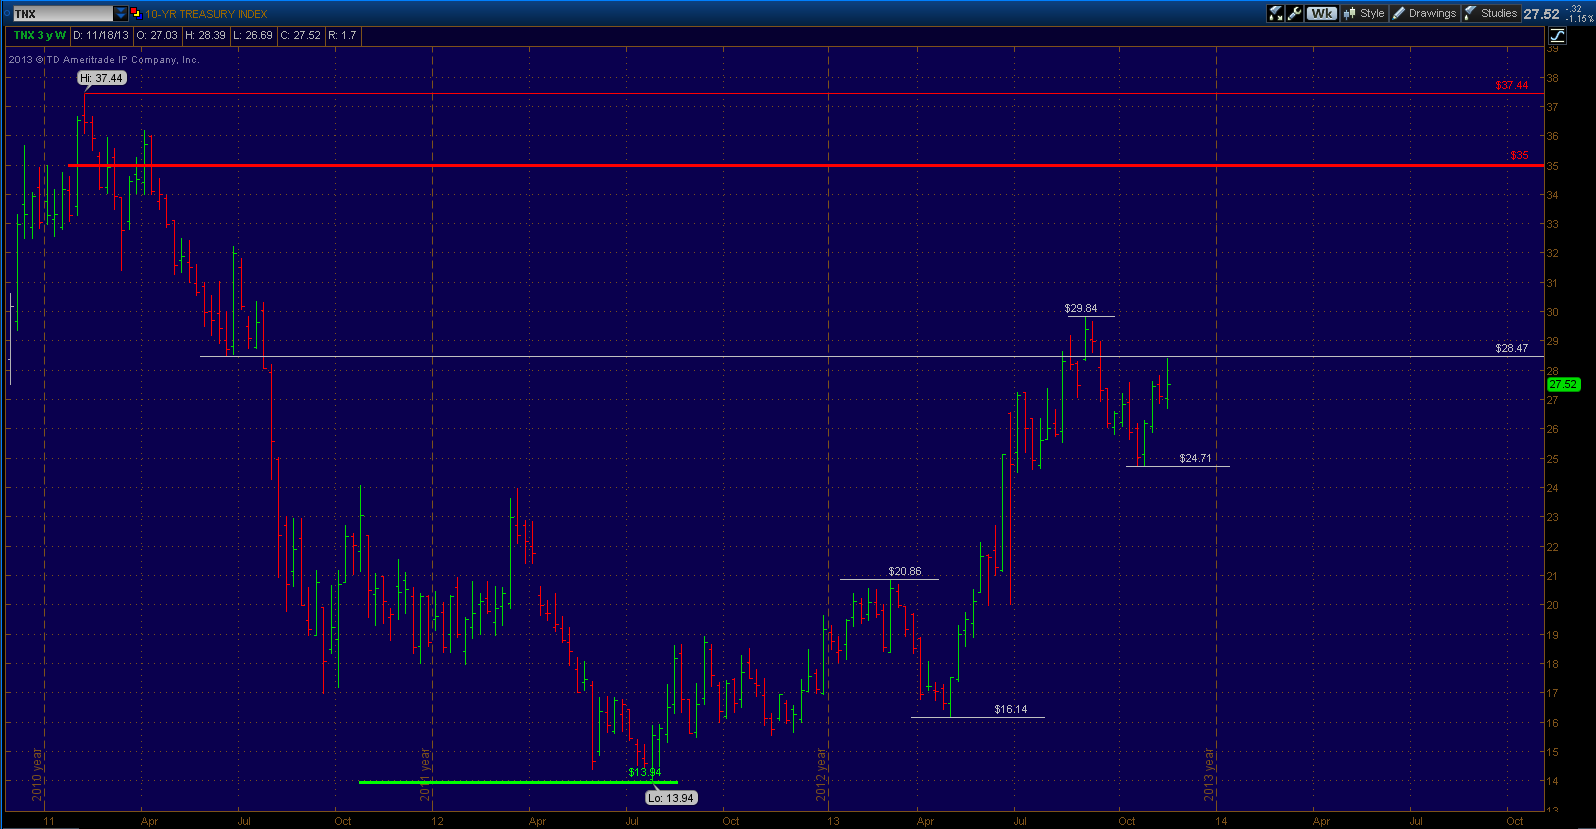
Taking a look at Apple next in the chart above, we can see that after a tremendous rally of almost 1000% from 2009 to 2012, the stock spent the end of 2012 and into 2013 retracing back into it's midpoint of it's amazing bull market. This is still a very bullish technical setup and the fact that so many have quickly given up on this stock makes me think that the run is not quite over yet.


However in the near term AAPL is running up into some key areas of resistance that deserve attention. The midpoint of this current correction stands at $545, an area that was nearly reached this week. Support not stands around $495 and $465 respectively. The next upside target would take us just above the major swing high just shy of $600. If this were to occur I would believe it's very likely that the drop in AAPL is over and over time new bull market highs would be achieved. But time will tell.


The last stock I want to look at is Tesla (TSLA). This happens to be a very popular stock for obvious reasons and it has had a tremendous run this year. As you know I like to follow patterns in the price charts to tell me if/when trends are broken or will continue. So looking at the corrections this stock has endured during the run up I see nothing out of the ordinary just yet that would make me want to sell all my Tesla stock anytime soon.

As you can see in the chart above the major corrections have come in at 22-23% before making new highs. So far we have a 21% correction since the swing high at $194.50 was formed. So as is I think the trend is still intact but I would not give it much room below $150 or the odds favor a drop to it's 200 day moving average at roughly $100.


Taking a short term look at this current correction in TSLA, I see a classic A-B-C correction pattern. Basically we have a 33 point drop from all time highs ($194.50 to $161.50). A retracement rally of roughly 26-27 points and then another equal sized drop to the swing low at $153.

This now puts short term resistance at approximately $180, strength above puts a price target of around $210. This level is computed by measuring the size of the rallies of each swing low which happens to be $55-60 each ($88 - $133, $104-$158 and $135-$194).

In reality, when analyzing all of these momentum stocks it may all come down to the direction of the broader market. As long as the S+P 500 maintains it's uptrend it's likely all three of these stocks will follow along. But it's always prudent to have a plan for the upside and the downside and be prepared for both.