Saturday, January 25, 2014

Weekly Stock Market Summary: Flight to quality theme continues for 2014...


Last week we talked about the risk aversion beneath the surface and how it differed in comparison to last year's excellent January returns for stocks. And of course we have talked at length for awhile now about the significance of the resistance in the Dow that was reached. Well this holiday shortened week continued that theme as the major averages all suffered loses of around 2% on Friday. And this comes after a triple digit loss in the Dow the previous day as well.

After Friday's drop the major averages have now exceeded the size of their previous correction, a major warning sign of potential trend change. In the S+P 500 as depicted in the chart above, the biggest correction in 2013 was a drop of 126 points. This projects support around September's high in the 1730 area with the 200 day moving average coming in as support at 1701 as of right now. Investors will not want to see the S+P 500 spend much time below.

As for short term support, traders will likely need to defend the last swing low at 1768.


The Dow has a little more consistent pattern, as each of the three corrections during 2013 produced drops of 900 - 1000 points. That projects support at the May and July highs coupled with the 200 day moving average below. As with the S+P 500, investors do not want to see price get below that zone.


As for the market internals, the S+P 500 advance - decline line closed below it's 50 day moving average. The NYSE advance - decline line continues it's bullish trend.


The relative strength this week came from Utilities, Energy and Consumer Staples as traders and investors looked to reduce risk and hunt for dividend and quality. Material, Industrial and Financial sectors under performed.


To reemphasize the risk averse theme the Volatility Index (VIX) spiked 30% on Friday. It's still below the 20 level, a level it topped out at a few times last year. Anything above 20 signals caution, anything over 40 would be more of a warning.


The last cyclical sector that still meets my criteria of being in a bullish trend (more on that in the conclusion) would be Technology (XLK). $35 becomes the next key area to watch with $34.50 as the line in the sand.


The risk aversion was confirmed in the credit markets as well, as the long term treasuries were the biggest beneficiary. This chart above just basically shows the investor demand for the safety of treasuries (risk off) to the demand for lower quality, higher yield bonds (risk on). This trend has turned from bullish to neutral.


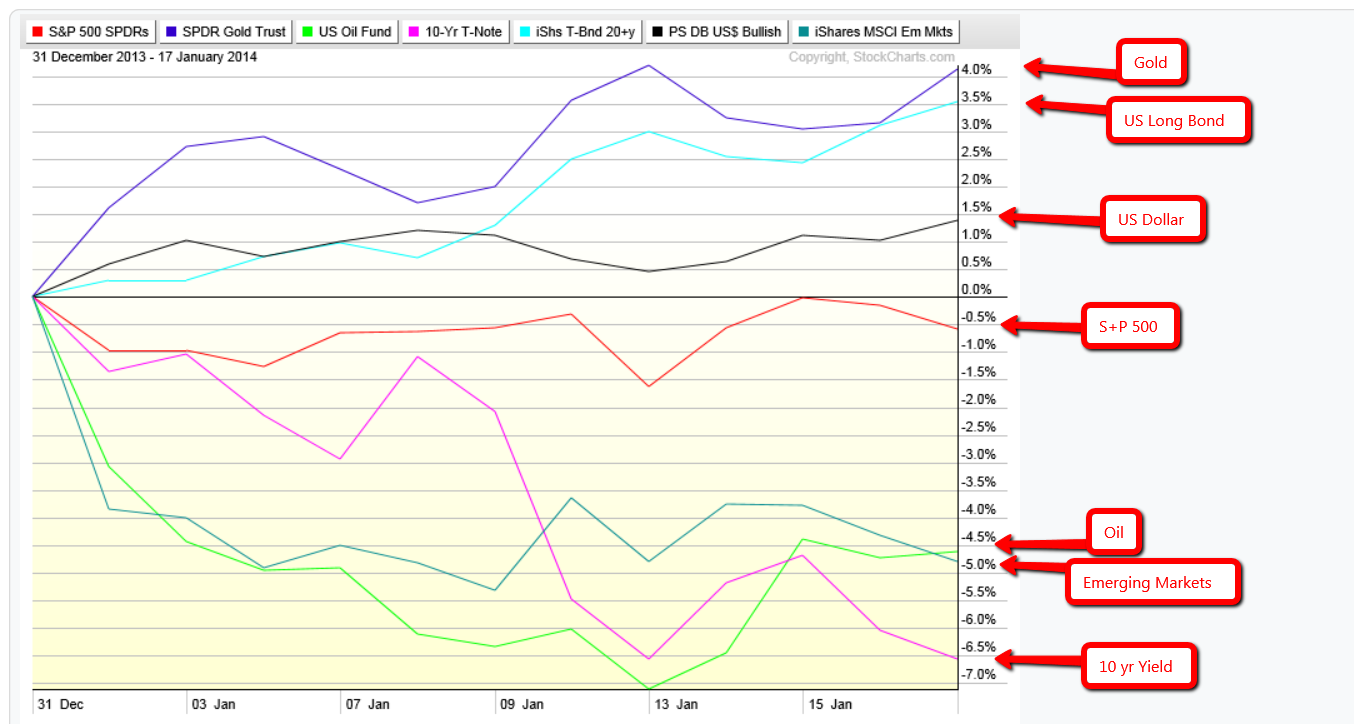
The year to date performance by asset class continues to show risk aversion and flight to quality. Although this is still a small sample size it does represent a shift from the previous. At this time last year the S+P 500 was up 5% ytd 2013.


In conclusion I am introducing a new concept. It is a trend defining tool that takes into account the four major averages, ten sectors, VIX, credit market indicator and 2 market internal indicators. This is not a market timing tool, as it will not spot major turns in the market, that is what the technical analysis will be for, rather it will define the trend at hand and the strength there of. This week a bunch of the trends turned from Bullish to Neutral, with Technology being the only cyclical sector remaining in a short term uptrend.

Saturday, January 18, 2014

Weekly Stock Market Update: Major Averages up trends remain, Sector and Asset class performance...


This week the market picked up in activity and interest as some of the largest and most influential companies reported quarterly earnings. The S+P 500 index started the week by dropping into the area of the first support level defined in last week's update.

We then proceeded to finish of the week by pushing higher and taking out 2013's swing high briefly before retracing into Friday's close. If you have followed my analysis, you know the significance of what I believe these resistance levels above, appear to be. However until aggressive sellers start to show up and volatility increase, I see no reason to fight this up trend for the time being.

So if next week we take out last week's high at 1850 on continued strength, the first projected upside target would come in between 1885-1895, matching the size of the previous two rallies, and into the upper boundary denoted by the trend line on the above chart.


The Dow Jones Industrial Average is in a slightly different setup. It has failed to take out it's 2013 high and is finding resistance at the down trend line depicted on the chart above. An upside break would likely take us to 16,850. However with the significance of the resistance above I would suggest investors (especially new money) to take a cautious approach until this is resolved one way or the other.


The riskier equity indices in the Nasdaq 100 (QQQ) and the Russell 2000 - Small Caps (IWM) show a more bullish picture. As both have traded above their 2013 high's and remain in solid uptrends.


The cumulative advance - decline line on the S+P 500 continues to remain in a solid uptrend. This basically means the advancing issues that make up the S+P 500 index continue to outpace the declining issues. Generally this bodes well for future stock market prices and it's another reason why we can not jump the gun in calling a market top just yet.


Market sector performance for last week shows relative strength for the week came in the Technology, Basic Materials and Health Care sector while the Consumer Staples, Energy and Cyclical (Consumer Discretionary) sectors under performed. Consumer Discretionary sector was under pressure from lowered earnings estimates and the performance Of Best Buy (BBBY) which dropped 30% on Thursday after issuing disappointing holiday sales numbers.


The volatility index continues to trade at depressed levels, it's hard to see a significant market top form with the VIX still trading in the lower teens. However the flip side of that argument can be made that the $12 level has been significant support historically and especially in the last 18 months as depicted on the chart above.


Taking a quick look at a credit market indicator I happen to follow closely. This happens to be the spread between the high yield (risky) bonds and long term treasuries. It's a simple and effective way of judging strength or weakness in the credit market itself. This particular indicator is giving me a caution signal right now as it trades below it's 50 day moving average. The real warning sign for me wouldn't come until/unless it traded below it's 200 day moving average (not depicted on the chart above). That is still a ways off, I'll keep you posted.


Year to date performance by asset class continues to show an overall risk aversion, however it's a very small sample size right now. Risk averse assets are outperforming year to date as Gold, Treasury Bonds, US dollar continue to be the ones showing year to date gains. 10 yr Yield, Emerging Markets, Oil and the S+P 500 continue to show losses year to date.

In conclusion, with potential significant long term resistance above it's prudent to show discipline and risk management at times like these. However it's also important to maintain a balanced approach, understand the time frame your operating in (whether trader or long term investor). As the major averages continue to maintain their up trends, for the time being, in what has been a spectacular and very surprising bull market now nearing almost five years in length.

Saturday, January 11, 2014

Weekly Stock Market Summary...


Not a whole lot has changed this week as both the Dow Jones and S+P 500 market averages continue to "digest" the gains accumulated over the holiday's. The charts above show this range bound trade just above short term support zones on both averages.

We have talked at length about the potential technical pitfalls ahead, however with both major averages trading above their respective 50 day and 200 day moving averages and the volatility index still trading in the low teens (which we will see later), there is not a whole lot to get bearish about for the time being.


Also in the bull camp, the S+P 500 advance - decline line remains in a solid uptrend and not far off from making another new all time high as well.


The volatility index traded down over 5% on Friday, typically you would see a spike up in volatility at or near an important market high. As of yet we have not seen anything remotely resembling that as the VIX continues to trade in the low teens which is near it's historic lows.

So even though we remain under resistance levels there is not a lot of signs pointing to any sort of imminent and important market top at the moment.


Sector performance for the week shows some risk aversion as Utilities show relative strength (long time since we have seen that) along with Health Care and Financials. The laggards this week came from the cyclical, energy and material sectors.


Taking a look at year to date performance by asset class, so far even though it's still early we can see a lean towards risk aversion to start the new year as Gold, Bonds and the Dollar are on top with year to date gains. And equities, yields and Oil are starting the year off in the red.

It's still far to early to read anything into this, but this is so far a much different start to the year compared to what we saw last year.

Sunday, January 5, 2014

Weekly Market Summary and 2013 Year in Review...


This week we saw a continuation of the "Santa clause rally" during another holiday shortened week of trading. We have now reached our main upside target objective of this bull market as highlighted in the chart above and referenced numerous times over the last few years.

In my opinion, investors should be cautious going forward until this pattern is broken. The pattern being, that each bull market high since 1997 (16 years) has consistently been around 2400 points higher than the previous. And now we find the Dow as overextended as it has been, on a technical level, in 16 years.

This pattern could certainly be broken, but unless or until it actually is I believe it's prudent to take a conservative or defense position in the time being. For more info on why these levels are potentially strong resistance please refer to my previous post.


In the mean time, some short term support on the Dow comes in around 16,175 as annotated on the chart above. This would about match the size of the last short term correction and marks a previous swing high as well.


A similar setup on the S+P 500, with 1800 coming in as support along with the potential support at 1813.


Going to keep it short this week with the holidays and short week of trading. The chart above is a quick summary of performance for 2013 among the asset classes. Equities were the big winner with Bonds and Gold the biggest under performers. We'll see what happens in 2014.


The relative strength for 2013 came in the Cyclicals (Consumer Discretionary), Health Care, Industrial and Financial sectors as Utilities, Tech and Basic Materials under performed.