
In last week's post we talked about the possibility of further weakness taking the S+P 500 down into the 1640's which would likely cap the downside. And that is exactly what happened. On Wednesday the S+P 500 dropped as low as 1646.47, at that point the correction was exactly 83.39 points in length. Almost identical to the previous correction from the high at 1709 (82.20 points-highlighted on chart above). It goes to show you that the best trades/investments almost always fly in the face of most current market data!
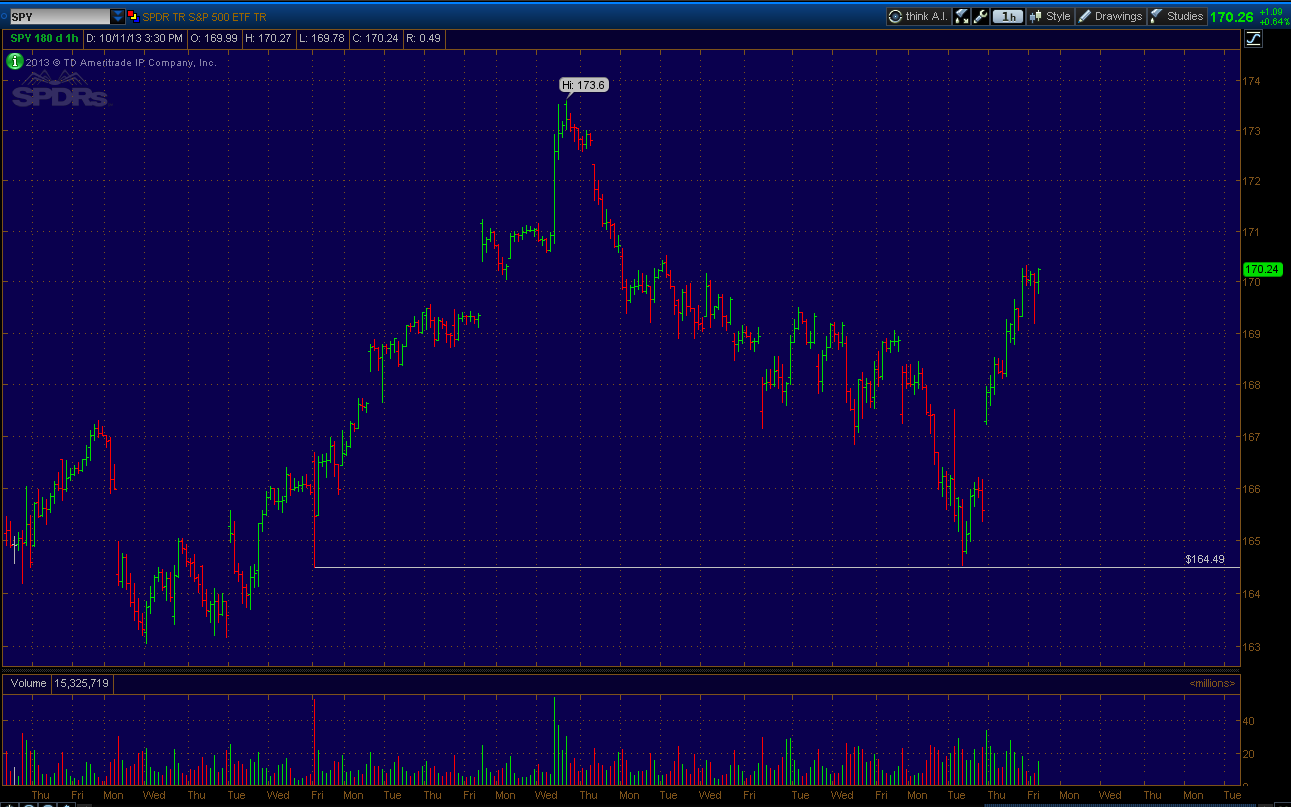
The SPY (S+P 500 ETF) actually tested the exact spot that was pointed out in last week's post.

The Dow Jones Industrial Average briefly took out it's lows, likely gunning for stops below, before reversing higher. You can see the divergence between the S+P and Dow, as the Dow has farther to go to make new highs and is only at it's midpoint of the September drop. Resistance will likely come in play around the 15,330 area, I don't expect this to be more than short term resistance but it is worth noting regardless.
On a quick side note, I hear a lot of people talk about placing their protective stops above or below key highs and lows. While I commend the discipline and risk management, placing these kind of orders directly above or below key pivot points is a sure fire way for losing your money. As the market generally has to auction above or below key pivot points to generate interest from the buyers/sellers to continue it's general trend.

Moving on, the Russell 2000 index is made up of small cap, mostly domestic companies. This is a very good index to watch to gauge the level of risk investor's are willing to take. This chart above shows a very healthy uptrend that is just shy of closing at all time highs.

The Nasdaq composite also shows a healthy uptrend, trading at the upper end of it's yearly range.

Taking a look at Bonds using the US long bond etf (TLT). We can see a short term down trend potentially building a base around the $102 low. We can also see that each short covering rally in the last two years have pushed higher by about $9 points. This will project around $111-$112 as resistance which there happens to be a couple swing lows in the vicinity and a 200 day moving average above. That is probably your best entry for shorts, a break out above would most likely produce a move up to $120 or so.

Tracking the US dollar using the etf UUP, we can see a pretty obvious downtrend longer term. This week we briefly took out this year's low to date and the 2012 low, before moving back above. This definitely has the potential for a short squeeze with a possibility of reaching that upper trend line above.
The Dow Jones Transportation Index remains strong as well. Also trading at the upper end of it's yearly range.

The cumulative advance decline line got a solid bounce this week as well. The big question remains, will we finally see an upside breakout? Really everything else in between doesn't really matter.

So what should we expect going forward? Personally I think the lows are in and the S+P 500 is headed up to at least 1775 and 16,500 on the Dow, over the coming months. Historically when we have a very good 1st quarter, we tend to close the year out well also. However in the short term we have moved quite a bit higher in a short amount of time. I expect to find some resistance around the 1709 area.
A scenario I could see playing out is highlighted on the above chart. 1670-75 should now define downside support for the next move higher. That would setup an inverted head and shoulders pattern (albeit a distorted one) that would target new all time highs.
So in conclusion, we are likely to see more short term volatility as Congress goes back and forth on an eventual resolution to the debt ceiling. But the probabilities that the low is in are strong. We should be on our way to our upside targets in the major averages.
We should also be aware that this bull market, by historical standards, is getting old. That doesn't mean that it has to end anytime soon, but any weakness should be taken seriously. We may well only have another 5% or so upside before a good sized 20-30% correction. That is what I am anticipating, and it should factor into the risk vs. reward of any strategy going forward.