In a week that featured a fair amount of intraday volatility due to headline news of the reality of the Government shutdown, the S+P 500 actually closed the week relatively unchanged, with the NASDAQ actually closing at a new bull market high. So as the "news and the noise" abounded, in terms of price action it was much to do about nothing.
In last week's post we talked about a key support area at 1685-1687 as defined by the May highs and Syria breakaway gap. Due to the anticipation of a government shutdown we found ourselves opening below that area on Monday's day session, a bearish implication for the short term trader's time frame. However I want to point out the fact that responsive buyers showed up almost all week, with the exception of Thursday.
This chart above is a 30 minute chart of the SPY (S+P 500 Index Fund). What I mean by responsive buying is the fact that 4 out of the 5 days this week the market closed well above it's open call. Say what you will, but this looks to me like demand still remains.
Now the real question is, where do we go from here? On the short term, personally I believe we are preparing to push higher to retest 1709 which is defined by the August highs and 61% retrace level of this current correction. I am using that level as my short term bull/bear line in the sand. Strength above (meaning a close above or continued price acceptance above) signals to me a high probability that the drop is over and we should see a market rally to at least 1775 on the S+P 500 and around 16,500 on the Dow. (Upside targets are explained in this post.)
However until/unless this occurs I am preparing for the possibility of some further short term downside. The chart above is a daily chart of the S+P 500 highlighting the 1640 level, as this would about match the size of the drop (82.20 points) that occurred after the August high.
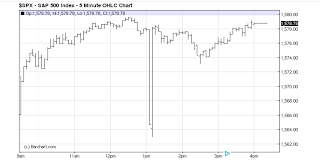
However the main reason I am focused on the 1640 area is the low that occurred on September 6th of this year. The 5 minute chart above shows that days price action and how the low was formed. The story behind this short term volatility is described by Briefing.com:
"The retreat coincided with headlines from the G-20 Summit in Russia where Russian President Vladimir Putin said his country will assist Syria if an external attack occurs."
This low was completely reversed in a short amount of time, but the market has a history of needing to retest and even briefly take out lows such as these before it can proceed higher. Those of you who follow market profile and auction market theory will understand exactly what I mean.
"The rapid decline occurred after the Associated Press Twitter account was hacked and false reports of an explosion at the White House surfaced on the site. The Associated Press has since acknowledged the security breach and the White House has issued a statement saying "the president is fine.""
The intra-day low came in at 1563.03.
Now let's fast forward two months later, the market was showing some short term weakness after it's May high. But as it turned out, all it was attempting to do was retest that low that was quickly left behind. It took a quick "peek" below and apparently there was very little interest and the market never looked back from there.
Of course there are many examples of similar price action. I've pointed out the most recent to express my point. Any weakness below 1670, which is this week's low, I have to believe the high probability then becomes a need to test that 1640 area before proceeding higher. I strongly believe that if this scenario materializes that 1640 will likely cap any further downside in the equity markets.
Taking a quick look at the cumulative advance - decline line I am seeing some potential signs of internal strength. As this reading is outperforming the broader market. Of course this really doesn't mean much until we can break above what has now become a "triple top" around the 37,000 level.
In conclusion: In the short term it appears there is some downside risk remaining. However whether this week's low becomes THE low or we need to push lower to 1640, the Intermediate and Long Term trends remain upward and I believe this should carry us to at least 1775 on the S+P 500 and 16,500 on the Dow over the coming months.
However in fairness we need to keep in mind the fact that this bull market, by historical standards, may be getting old. The risk to reward at current levels is not as favorable as that was present in 2011. I say that to get across the point that any real signs of weakness at these levels going forward, really needs to be taken seriously.
It is my humble opinion that any significant correction of 20-30% will not occur until our upside targets are met. However the market could care less about any one's opinions, so proceed with caution!


