
This week the market picked up in activity and interest as some of the largest and most influential companies reported quarterly earnings. The S+P 500 index started the week by dropping into the area of the first support level defined in last week's update.
We then proceeded to finish of the week by pushing higher and taking out 2013's swing high briefly before retracing into Friday's close. If you have followed my analysis, you know the significance of what I believe these resistance levels above, appear to be. However until aggressive sellers start to show up and volatility increase, I see no reason to fight this up trend for the time being.
So if next week we take out last week's high at 1850 on continued strength, the first projected upside target would come in between 1885-1895, matching the size of the previous two rallies, and into the upper boundary denoted by the trend line on the above chart.

The Dow Jones Industrial Average is in a slightly different setup. It has failed to take out it's 2013 high and is finding resistance at the down trend line depicted on the chart above. An upside break would likely take us to 16,850. However with the significance of the resistance above I would suggest investors (especially new money) to take a cautious approach until this is resolved one way or the other.


The riskier equity indices in the Nasdaq 100 (QQQ) and the Russell 2000 - Small Caps (IWM) show a more bullish picture. As both have traded above their 2013 high's and remain in solid uptrends.

The cumulative advance - decline line on the S+P 500 continues to remain in a solid uptrend. This basically means the advancing issues that make up the S+P 500 index continue to outpace the declining issues. Generally this bodes well for future stock market prices and it's another reason why we can not jump the gun in calling a market top just yet.

Market sector performance for last week shows relative strength for the week came in the Technology, Basic Materials and Health Care sector while the Consumer Staples, Energy and Cyclical (Consumer Discretionary) sectors under performed. Consumer Discretionary sector was under pressure from lowered earnings estimates and the performance Of Best Buy (BBBY) which dropped 30% on Thursday after issuing disappointing holiday sales numbers.

The volatility index continues to trade at depressed levels, it's hard to see a significant market top form with the VIX still trading in the lower teens. However the flip side of that argument can be made that the $12 level has been significant support historically and especially in the last 18 months as depicted on the chart above.

Taking a quick look at a credit market indicator I happen to follow closely. This happens to be the spread between the high yield (risky) bonds and long term treasuries. It's a simple and effective way of judging strength or weakness in the credit market itself. This particular indicator is giving me a caution signal right now as it trades below it's 50 day moving average. The real warning sign for me wouldn't come until/unless it traded below it's 200 day moving average (not depicted on the chart above). That is still a ways off, I'll keep you posted.
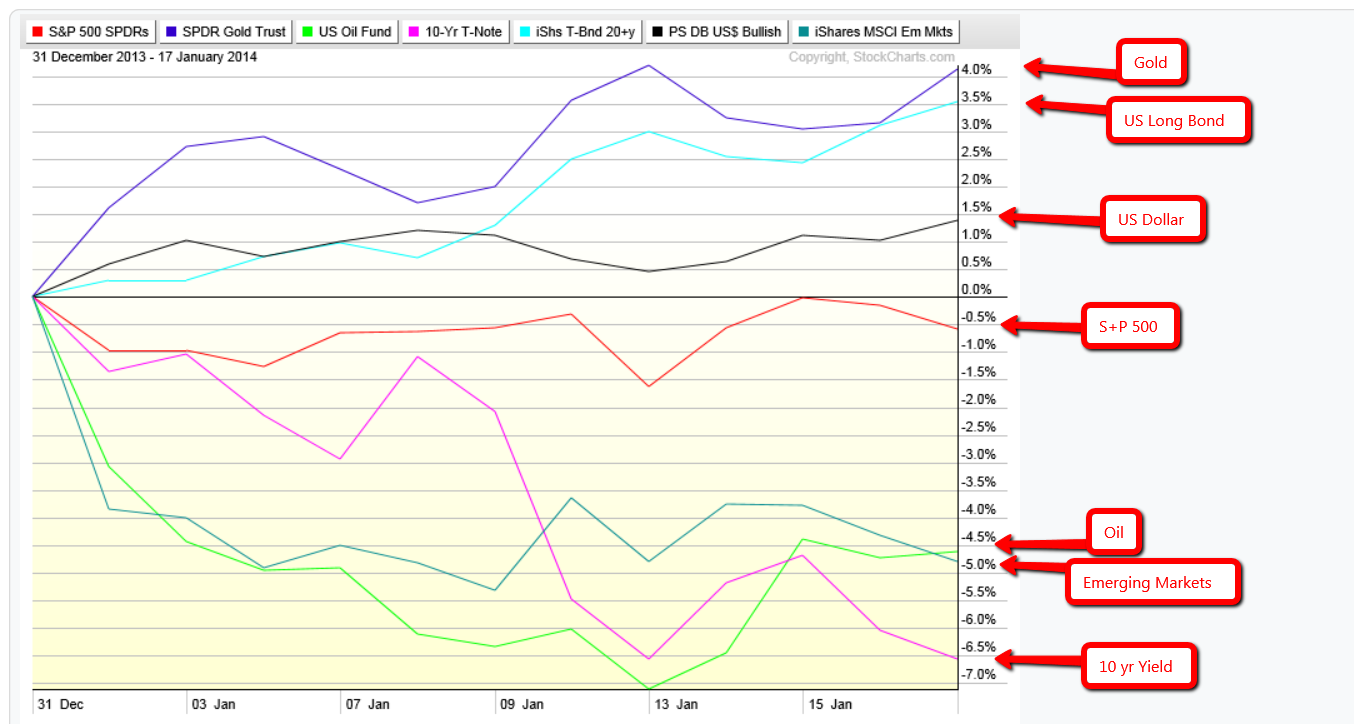
Year to date performance by asset class continues to show an overall risk aversion, however it's a very small sample size right now. Risk averse assets are outperforming year to date as Gold, Treasury Bonds, US dollar continue to be the ones showing year to date gains. 10 yr Yield, Emerging Markets, Oil and the S+P 500 continue to show losses year to date.
In conclusion, with potential significant long term resistance above it's prudent to show discipline and risk management at times like these. However it's also important to maintain a balanced approach, understand the time frame your operating in (whether trader or long term investor). As the major averages continue to maintain their up trends, for the time being, in what has been a spectacular and very surprising bull market now nearing almost five years in length.