
This week we failed to see follow through to the previous week's rally, as the S+P 500 was unable to take out it's previous high, creating a lower high - lower low scenario. Last week we talked about the support zone below that the S+P did front run. Well this week we fell back down and this time we did hit that support zone below.
I am using this week's low at 1772 as the gauge going forward. Any weakness below that next week and the expectations would be for at least a drop to 1730.

The 60 minute Dow chart above shows the bounce off support and failure at resistance. Now we have a scenario where what was once support has now become resistance for the time being.

The expectations for any further weakness next week would likely push the S+P 500 down to the 1730 area as the next stop and could potential be the kick off to something bigger.

As for the Dow in the event of further weakness next week, the expectations would be that a drop back to 15,185 and it's 200 day moving average would be it's next likely downside target.

Performance by market cap this week saw the Mid-cap's "outperforming" while the small caps saw the biggest decline at 2% for the week.
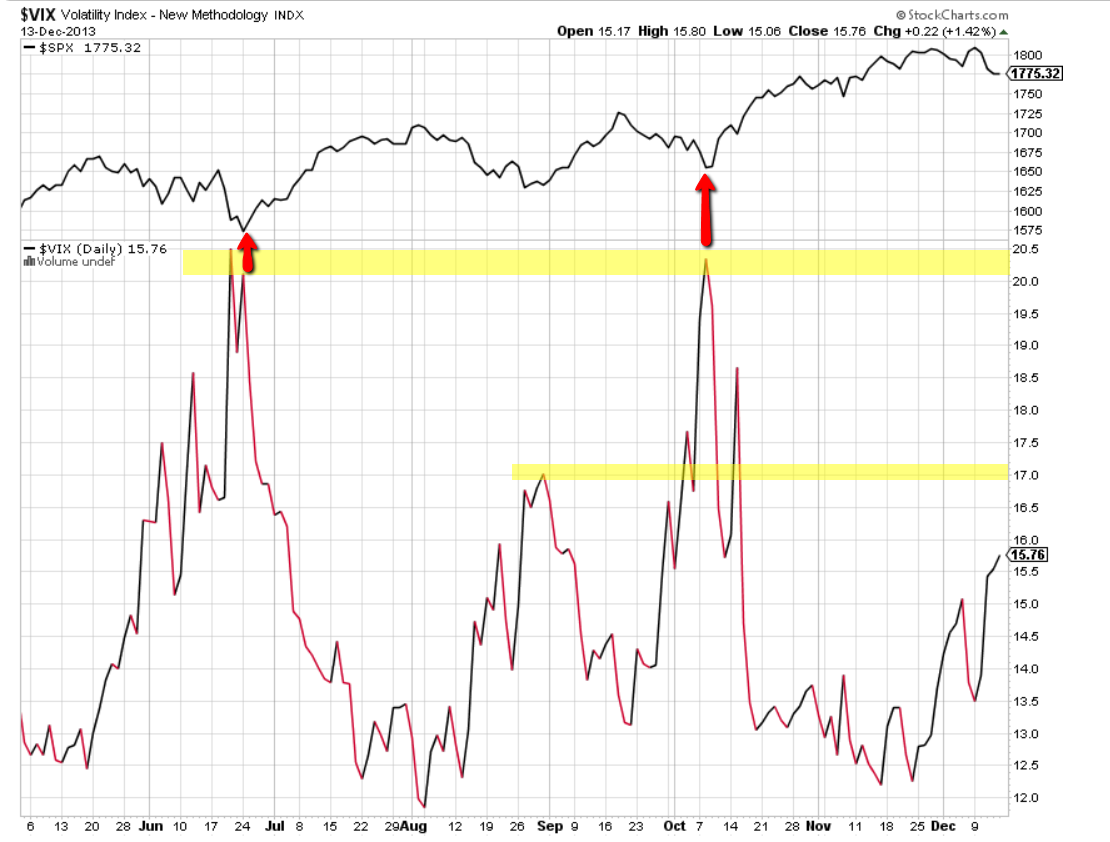
Taking a look at the Volatility Index (VIX) we are starting to see a little more "flight to protection" as the VIX reading gets back above 15. The next important level would be 17 and most important would be 20. We have already seen two important lows in the stock market this year once the VIX hit 20.


Sector performance compared to the S+P 500 this week shows relative strength coming from the Consumer Discretionary, Materials, Industrial and Energy sectors. And weakness from Health Care, Consumer Staples and Technology.

On the Bond side of the equation we saw the best performance out of the Invest Grade Corporate, TIPS and the 30 yr. The worst performers were High Yield and the 10 year treasury bond.


Some basic indicators gauging credit market health above, the first (spread between 2 year and 10 year treasury yields) is inverted so the lower the better. This most recent spike higher is worth noting but still trading at the lower end of it's range.
The bottom chart is the difference between High Yield bonds and Long Term treasuries using the most liquid exchange traded funds that track the spot price. This indicator continues to show relative strength in the credit markets continues. There is still not a whole lot of fear beneath the surface.
Next week will likely be all about the Fed and their FOMC statement and Economic projections on Wednesday. Traders and investors alike will likely focus exclusively on whether the Fed will "Taper" it's QE 3 program and when. I have no real opinions on the matter and have no idea what they will due on Wednesday.
However I think it is likely that the stock market continues it's rally if they decide not to taper now or in the near future. And if they decide to taper soon the market's initial reaction would likely be to continue it's descent below in the midst of it's short term uncertainty this event might bring. But as always, time will tell.