All the major market averages remain in defined up trends. The S+P 500 along with the broader market suffered some higher than usual volatility on Thursday but finished the week strong on the back of a better than expected Non Farm Payroll report.
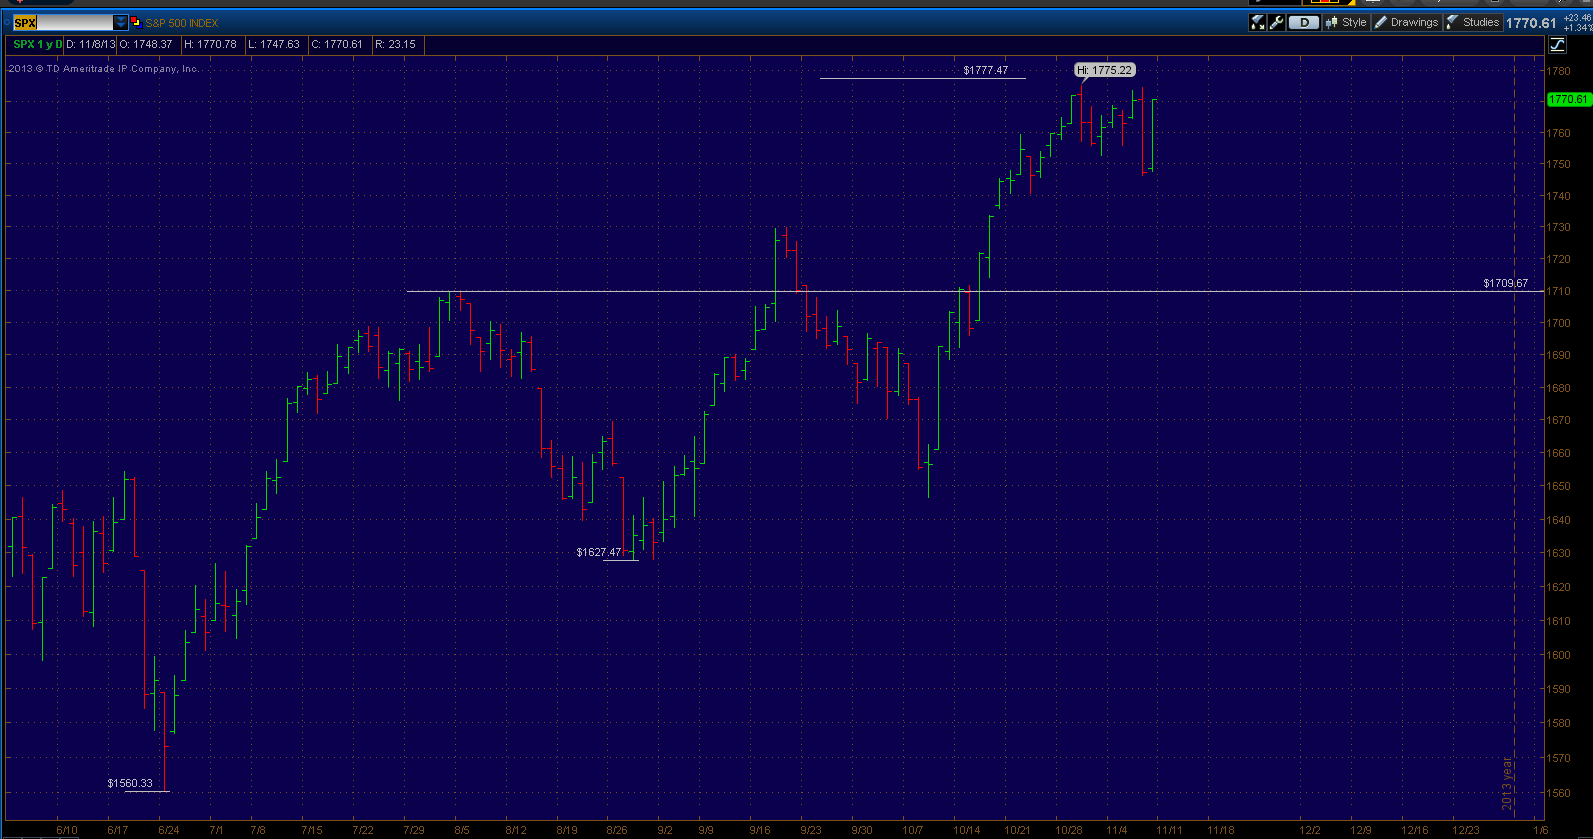
We have addressed the technical structure of the S+P 500 in the last post, last week and not much has changed since. As the chart above denotes, any potential further weakness in the near term should find support near the May highs at 1709 which from current highs would match the size of the last two corrections as well. Also last week we highlighted the fact that the upside target in the S+P 500 had been reached and that the next ultimate target really came down to the Dow from here on out.

Here's a look at the Dow chart, we can see how this latest consolidation phase taken place above the May highs along with the fact that this week we were able to close above each of the last three swing highs. It's really hard to get too near term bearish right now.

Here's is what may become the ultimate target for this bull market. This chart above shows trading in the Dow going all the way back to 1998. I've highlighted each bull market high point over the last 15+ years. You can see that each time the Dow got approximately 2400 points overextended above it's previous bull market top, the bull market ended.
Using this calculation we can project a potential bull market target of approximately 16,580 - 16,645. As further confluence we can see the last bull market lasted 5 years so March of 2014 would also match the time frame of the previous. Along with the fact the last two bull market highs came 7 years apart (2000,2007) another 7 years would also yield 2014.
Now the intentions are not to try to "pick a top" but rather highlight a historical pattern and heighten your alert if indeed we get some weakness off those levels. Also I am not in anyway saying a major crash will proceed either, I am very long term bullish and believe the markets are headed much much higher over time. Check out this post I created over the summer if you don't believe me.
However a good 20% correction from our target levels would healthy and in line with the historical market moves. This is the more likely scenario in my mind, I will certainly elaborate on specific downside targets if we see weakness setup. But for know there really is no reason to jump the gun and overthink things.

Let's take a look at the Russell 2000 in the above chart as that is what I believe was the key to market movement this week. I've highlighted the supply and demand pattern I can see develop since early this year. We have seen a series of rallies between 110-120 points and declines between 44-55 points.
That pattern came into play again this week as the Small caps have underperformed lately. We will see if this momentum can carry the broader market higher or will the S+P 500 drag it back to so it can find it's own support around the 1709 area we pointed out.

Taking a quick look at a couple stocks, Cisco (CSCO) has seemingly found support around $22 which was a prior pivot high and also nearly matched the drop the October highs to the low at $23.33 when taken from the last swing high at $24.80. Cisco has performed pretty well this week and the real test should come soon as resistance is near at $23.75. I believe a break above bodes well for shifting the short term trend back up again and making a run back to $26.

Sticking with Tesla (TSLA) from last week, we did a pretty good job of spotting resistance at $180. The high for the week ended up coming in at exactly $181.43 before falling after earnings were announced. Resistance now stands at $160 and as long as it stays below this stock is likely headed to support at $115 and possibly the 200 day moving average around $105.

Taking a look at the Advance - Decline line on the NYSE. We can see a clean "back and fill" reaction as it fell back to it's previous two highs for support.

Let's conclude with the relative performance by sector since the October 9th swing low was put in.