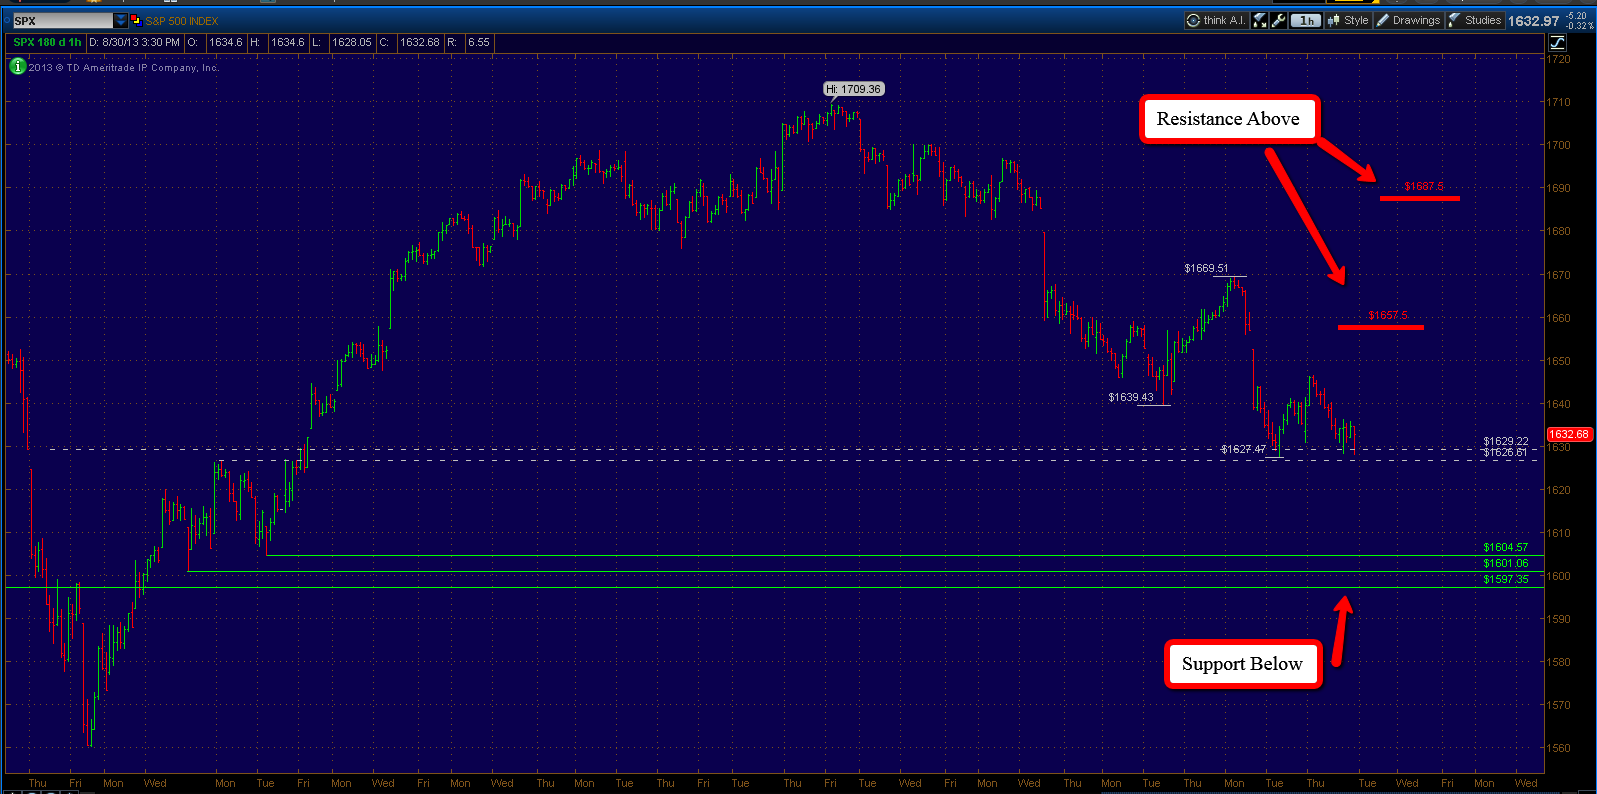
As the short term trend in the major averages remains downward. The S+P 500 now finds itself in what I believe is a strong short term support level. This is defined in the chart above by the 1626 settlement price that preceded one of the worst days of the year for stocks. Along with a previous swing high left behind in this most recent uptrend. I believe this support zone will prove to be strong enough for at least a retracement rally.
Going forward I now see resistance as marked on the above chart at 1657.50. Any further strength I would expect to see 1687.50 as the next logical upside target. Any continued weakness below this most current 1627 low would signal a drop into what I believe to be stronger support around the 1597.35 - 1604.50 zone. I am not anticipating this correction to yield much more than this to the downside and still feel that the S+P 500 will trade above 1750 over the next few months. However I do see some technical weakness in the advance - decline line which I have noted for awhile now.

Oil has hit our last upside target! In this post back in July I laid out a couple upside targets for Oil and last week we hit the last upside target and sub sequentially called at least a short term top in prices. Any further weakness could have us dropping back into the $98 level which happened to be the top of the last trading range.

Another upside target nearly hit. This time in Gold, using the GLD which is the ticker symbol for the iShares Gold trust etf. It stopped a little short of the mark as it hit one of the previous major swing highs. I would expect to see support now stand in the $130 level and the next move higher to push above the $143.43 high left behind in April of this year.

The advance - decline line is showing some glimmers of strength here. As the S+P 500 made new lows last week, this indicator actually made a higher low. Judging by this I believe it is possible that we can see a retrace rally that is bigger in size than any of the previous we have had since the August 2nd high. That is where the 1687.50 level would come into play.

With a holiday shortened week we still have some important economic data for the markets to digest. We have some central bank policy statements and press conferences from both the BoJ (Japan) and the ECB (Europe). I believe most notable for domestic data will come on Friday, as the monthly employment data is released. This may become very important to traders as it could sway the policy decision by the Fed when it holds it's own statement and press conference in two weeks.