As a follow up to my last post on the investor's time frame. Here's a little something for the trader's out there!
Obviously the correction never materialized and the S+P, OEX and DOW all trade about their 2007 highs now. I see no signs of a shakeout and significant market top so I believe the bullish momentum on the investor's time frame has clearly negated any significant correction potential for the time being.
The top chart above is a daily chart of the S+P 500 showing the uptrend since the November 2012 low. As you can see there is a handful of micro bullish and bearish campaigns. The bears have caused corrections all in the vicinity of 46-60pts each while producing follow up rallies of 100 and 130 pts respectively.
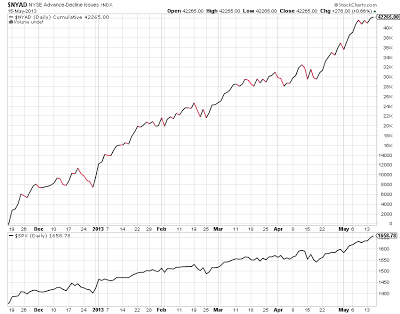
The bottom chart is the cumulative advance - decline line of the New York Stock Exchange, it registers the amount of stocks advancing versus declining on a cumulative basis. So it gives you a look "under the hood" so to speak. As you can see the advance - decline line is indeed making new highs with this rally as well. So using this information and the fact the S+P 500 is trading well above it's decade long trading range without a significant increase in volatility leads me to believe this is indeed a real breakout.
Now I do expect another equal size 46-60pt correction to begin at any moment. Possibly around 1665 on the S+P 500. I expect to see support established and at the worse case scenario a drop back into the 2000 and 2007 bull market high levels which have been denoted on this chart as the 2 red horizontal lines. I do not expect the bears to get much more than that anytime soon.

