
 The S+P did indeed drop into our price zones discussed this week. We saw a relief rally occur during Friday's day session. Question is was it just an oversold bounce or something more?
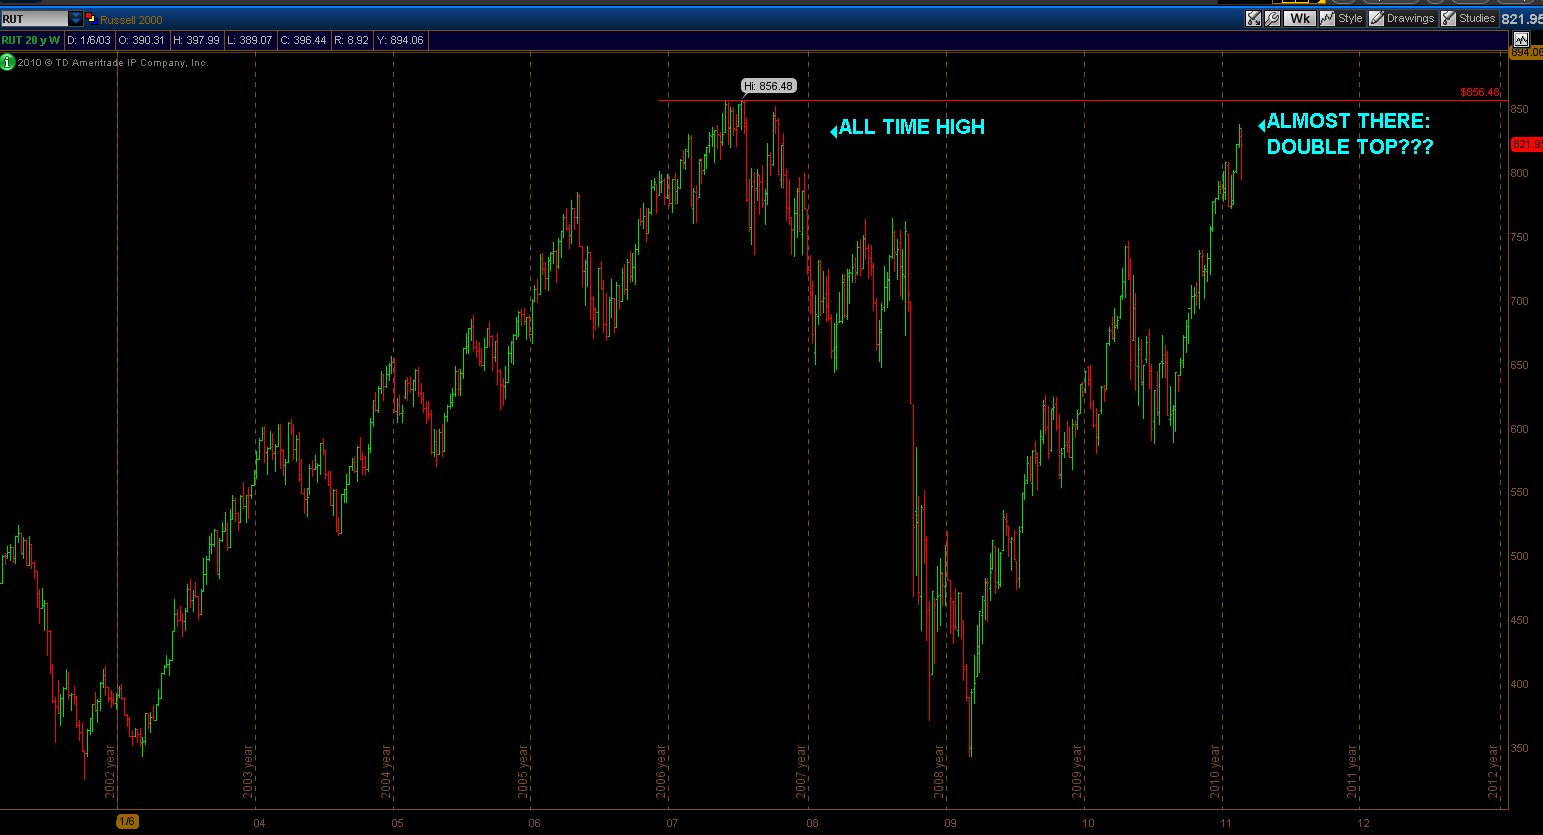
One thing we have to keep in mind is the type of resistance we are up against in the short term. The top chart above shows the weekly chart of the NASDAQ, as you can see we came into the top of the trading range dating back to 2007. The middle chart shows the small caps (Russell 2k), also up against some tough resistance levels coming in at all time highs. So we must keep this in mind as this could end up warranting a deeper size retracement.
The bottom chart shows the S+P 500 futures 4hr, we are inside a measured move long taken from 1/30/11 's low to the 1343 high. Market has paused and began to rally here, I am going to use that low that we created this week as my bull/bear line in the sand for the short term. Above we are coming into resistance, I am looking to see if 1323 - 1330 will hold. If so look for a drop into the 1270 area to follow. If bulls can break 1330 new highs will likely follow shortly thereafter.
In either event I expect to see new highs in this market by April/May, with a high of at least 1360- 1380 before this bull trend is over and done with.