Staying ahead on the right side of the markets with cutting edge technical analysis and forecasting methods.
Saturday, September 28, 2013
Stock Market Update: S+P 500 hits support, sector performance, market internals and more...
With this week's sell off the S+P 500 has come into support as identified on the chart above. This support zone was referenced in last week's update at 1685-1687 as defined by the May 22nd high along with the August 14th breakaway gap down on the initial news from the Syria situation that sent the market into a brief tailspin.
I am looking at this level very closely next week as a failure here would send us back down to the 1640 low on the chart above, this was a low that formed very quickly off of some news out of Russia regarding the Syria situation also. This level was immediately rejected then but any further weakness next week would signal to me that this low would need to be retested before a sustainable move higher could proceed.
I am expecting another push higher to at least the 1775 level (reason explained in this prior post) once support is established and before all is said and done.
It is also important to point out the fact that this current bull market off the 2009 lows is indeed getting pretty old by historical standards. This means that any real signs of internal weakness should be taken seriously as risk/reward is not as favorable as it was in 2011 and 2012 when I made this statement.
Let's take a second to look at the sector performance year to date in the above graph. Services (Consumer Discretionary), Healthcare and Industrials are our relative outperformers.
Consumer discretionary chart above reveals continued strength as it continues to make higher highs with the S+P 500 and trades above it's rising 50 and 200 day moving averages.
Health care sector shows the same underlying continued strength with higher highs and above 50 and 200 day moving averages.
Industrials also show the same bullish picture, trading well above it's August highs and moving averages.
There is a lot of talk of some potential head and shoulders pattern brewing in the financials, frankly I do not see it. While it is true the financial sector failed to make new highs with the major averages, this graph above still shows performance in line with the S+P 500 since the August 27th low at 1627 in the S+P 500. So I think any talk of a reversal in trend based on that one factor alone is jumping the gun to say the least.
Taking another weekly look at the market internals in the form of the advance-decline line of the New York Stock exchange we can see the stall at the May and August high prints. As I have stated on numerous times, we need to see a break above to keep this trend up alive. This week I am seeing some potential strength brewing beneath the surface as this reading still close to it's all time highs even though the S+P 500 has pulled back a good 3% from it's highs. As always we will have to keep a close eye on this reading the next few months.
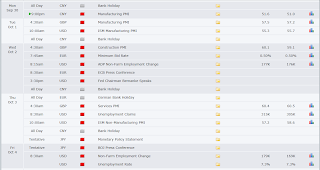
This weeks economic data will be focused on Friday's unemployment report. But of course the main event will key on the gridlock in Washington and the debate regarding the debt ceiling. I suspect we won't see a meaningful rally until some kind of resolution, albeit short term, is achieved. There is sure to be some short term volatility in between.


