Staying ahead on the right side of the markets with cutting edge technical analysis and forecasting methods.
Wednesday, July 24, 2013
Apple (AAPL)...
Apple came out with their Q3 earnings after the bell yesterday. Business Insider has some excellent in-depth coverage that I would highly recommend checking out in more detail. Basically the key takeaways were:
Revenue: $35.3 billion versus $35.18 billion expected by sell-side analysts. Whisper was $37 billion. Apple's guidance was $34.5 billion (midpoint).
EPS: $7.47 versus $7.34 expected by sell-side analysts.
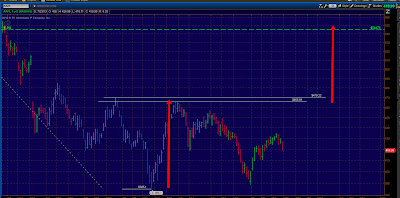
From a technical/price action stand point, I have posted the above charts. The top most chart shows the decline in prices from $705 to it's most recent just under $400. It's interesting to note that there have been two separate but almost identical $200 point drops in the stock price that got us to those most recent lows.
I believe we are in the middle of a base building pattern that should conclude with a break out to the upside. The bottom chart above shows that pattern a little closely, it does appear to have a somewhat distorted inverted head and shoulders pattern. I think $420 below is decent support going forward and the real test will be can we take out that $465-$470 high.
If we can, a move back into $550 would be a high probability, which would coincide with the top end of a projected trading range and midpoint of the $705 highs to current lows.
I think any further weakness below $420 and of course $385 would send the stock price back down to $300. The bear market in Apple during the 2008 financial crisis sent the stock down over 61%, so an Apple stock price around $300 would about match that bear market drop in percentages. I would have to assume this scenario is unlikely but if it did occur, would make Apple a great buying opportunity.
It's always important to have a plan for both sides of the trade, it helps keep you from becoming "married" to one side.

