
Last week we talked about the importance of the FOMC statement and press conference of Fed Chairman Ben Bernanke. The importance was more so on how the market reacted to the statement then the actual statement itself. We also noted the weakness in the market internals and sector performance and how that was likely to continue. And that is exactly what we got, after beginning the week positive the stock market continued it's sell off after the FOMC statement on Wednesday afternoon and then into Thursday and the Friday morning session before finding some short term support.
So what is likely to happen next? As I said all along, I did not think the 1600 level on the S+P 500 was strong enough to support a rally to new bull market highs. That proved to be correct as we find ourselves trading as low as 1577 this week. This means in my opinion that we still have some more downside to go.
I'll reiterate my belief that strong enough support will not be found until the 1550-1530 area, with emphasis on the lower end of that range. In the chart above (Weekly chart of S+P 500) I have highlighted the last two market corrections since the beginning of 2012. One interesting thing of note is that each correction lasted exactly 9 weeks before bottoming out. That would equate to the week of July 22nd to July 25th for a potential key turn date.
Now I do believe that price is more important than time, but time is still an important piece of the puzzle of speculation. If 1530's traded next week I would certainly take the long side even though it would only be the 5th week of the correction.

Now let's drill down a little closer, this chart above is a daily chart of the S+P 500 so we can see the price action a little clearer. Since the May 22nd high we have had two retracement rallies of 40 to 50 points in length. Friday we hit the lower end of this price channel so it is certainly possible to get another equal sized retracement rally up to the strong resistance point marked on the chart, as well as the upper rung of the price channel. I expect any such rally to stop at or below that level and then proceed to the final destination. If you look clearly at the chart above you can see that the bottom rung of this price channel on the dates of July 22nd to July 25th (our key turn date) comes in around the 1540-1530 price level. That looks about right to me!

Taking an updated look at the cumulative Advance - Decline line we see continued confirmed weakness and another lower low.

Our sector performance for this week was a mixed bag, as opposed to last week's which clearly signaled risk off. This week we see some strength in the cyclicals and financials but also weakness in technology and energy.
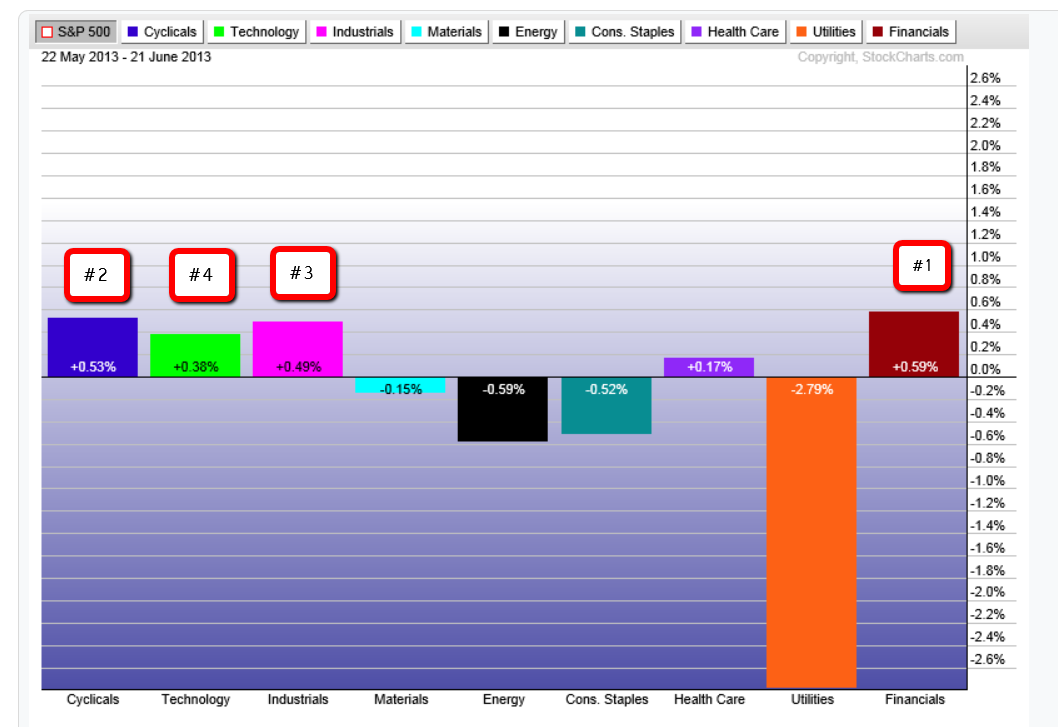
This chart above shows the sector performance since the May 22nd high. Financials now have the highest relative strength followed by cyclicals, industrials and technology. As of right now, this does not seem to have the characteristics of a major market top before a significant drop.
So to sum up, in the very near term we should expect some type of retracement but most likely proceed lower into strong support. If we do see that resistance level above taken out, I'll conclude that the correction is over. But most likely we should see lower prices over the coming weeks. In either case once this correction concludes, a march to new bull market highs will commence, taking the Dow into the 16,500 level. We will discuss that in more detail when the time comes.

I will conclude this week's market update to take a minute and talk about Gold. Commodities came under significant selling pressure during this week's market correction. Now Gold comes into some significant price levels and deserves to be mentioned going forward. This chart above is a weekly chart of Gold spot futures contract. This chart was used during a post on my blog that I created on May 12th outlining key price levels going forward. In the post I talked about how I felt the odds where that we would end up making another lower low before the market found support.

And here we are, we find Gold now trading at the strong support level highlighted in May. I am unsure at this time, if this will become strong enough support to take Gold prices eventually to new all time highs. But I believe it is good enough for a retracement rally back into the $1526 level which is the major swing low that I have marked on the chart.