Thursday, October 14, 2010

Thursday October 14th Review and Analysis.....

Support and Resistance levels worked well today, our bull/bear line in the sand worked very well.

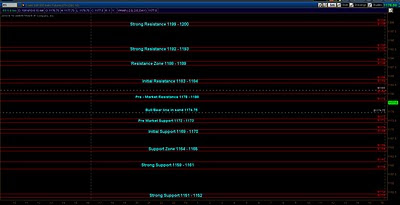
We spent much time above the 1174.75 line in the sand in the overnight session, and was even able to hold that level after the dissapointing UE claims number. But shortly after 9am we broke through to the downside down to pre market support level for a small pause, but lack of buyers called for even lower prices, we then tested the initial support level where we got an improved bounce back into the 1174.75 line in the sand.

The market became bracketed between initial support and the bull/bear line in the sand making for some decent two way trading. However we broke to the downside shortly after the European close as the finincial sector weakness early on brought the broader market down with it.

We fell to the support zone and got another bounce in that area back up to the initial support level. What was support became resistance and the market made one more break to the downside to make one more/last lower low.

Now there was no real support at that level but if you take yesterdays day session range which was 12pts, you take that 12pt range and subtract it from the 1175.50 high you get 1163.50 which is very close to the 1162.50 which eventually became the low for the day.

The maket going into the close and in anticipation of the Google earnings release broke back inside the initial balance and rallied back to the high extreme area of the day showing more conviction by the bulls.

We have heavy acceptance in the 1168 area today, overnight and pre-market support and resistance levels will be 1177 - 1178.50 on the upside, 1168 - 1166 to the downside.

1180 - 1181 could be tested in the overnight session as Google as I type this is trading some $40-50 up already and the Nasdaq futures have made a new 2010 high already.

I am going to use my bull/bear line in the sand as 1181, bullish above and bearish below.

Thursday Oct 14th Support and Resistance levels.....

The Market has held the 1174.75 previous weekly high most of the overnight session with USD weakeness, the broader markets show risk seeking is continuing, but this can change once the cash open begins. I am going to use the 1174.75 high as my bull/bear line in the sand for today. I do believe a break back down to re-test the 1127 (2009 high) will occur in the near future, but so far no clear cut signs of that happening yet.

Econ News from UE Claims to PPI coming out at 8:30am, Nat Gas report out @ 10:30am, trade carefully!

Wednesday, October 13, 2010

Wednesday October 13th Review and Analysis...

The market opened up with a gap up out of balance and out of yesterday's range completely, setting up an imbalance from the start.

We had an Open - Test - Drive open with price pulling back to test the high of yesterday at 1169. Sellers unable to push price below that price level coupled with price then breaking the overnight or Globex highs signaled a trend day in the making.

The key levels worked well for both short and long trade facilitation, but given the market structure today, shorts were very risky.

We had a 12 point day session range with more volume generated today than yesterday, with heavy acceptance in the 1178 area.

For the overnight, I am using that 1178-1180 area as initial resistance with 1181 being the today's high. I am using the 1172 -1173 level as initial support. With 1174.75 being the last significant top level.

1183 - 1184 above as resistance, the same 1169 -1170 level can be used as support along with 1164 - 1165.

More to come tomorrow....

Sunday, October 3, 2010

Monday September 27th 2010 - No news

Globex Range 7.75 pts

Market opens below Globex midpoint and takes out globex low

RTH range is 8 pts with a 5pt Initial Balance with no news to move to warranty any movement with conviction. Market closed near its lows below midpoint and VWAP with a negative TPO count, sets up for continued weakness into overnight-am session.

Wednesday, September 8th - No news Obama speaking at 2pm

Globex Range 10.50pts

Market opens above the midpoint of Globex range taking out Globex high with range extension.

RTH range is 10.75 pts with an 8 pt Initial Balance - high got taken out with range extension

Tuesday September 7th 2010 - No news


Globex Range 12.25 pts
Market opened below midpoint of Globex range, took out Globex low.
10pt RTH range with 8pt Initial Balance, minor range extension to the downside closing below midpoint and VWAP.

Wednesday, August 18, 2010

August 18, 2010..... It's been awhile!

First off cheers to our 1220's call back in January/February of this year, it was certainly an uphill battle since no one believed it. Turns out we called the top so far to the very point. Congrats to any and everyone who was able to capitilize on that market move!

We are looking here at a daily price chart of the SP 500 cash index, after putting what in my opinion is a low that will stick for awhile (more on this later) at the 1010 level in the SP 500, we had a couple measured moves long into an eventual double top at the 1130 post fed comments.

What proceeded was a full 50% retracement and a previous unfilled gap (*1*) which was hit on Monday, it called the low and we rallied from there.

What happended yesterday is that we ran into a minor 50% short setup opposing the long setup. That area provided great shorting opportunity and caught the high of the day.

As for now, bulls have control of the short term direction of this market, but resistance still stands @ 1099, 1106, and a previous unfilled gap @ 1121.

However I believe these resistance levels will provide only temporary resistance as the long setup target of 1155 becomes achieved. We'll take it day by day as things progress, but for now path of least resistance is UP.

Monday, March 15, 2010

Monday March 15th Review


Well another great day of trading, as prices rotated down in the morning and finished strong in the afternoon and into the close.

Top chart is a daily chart of the ES, showing the Fib retracement levels off both the 1040 low and the 1084.50 previous low. We had a 23% fib level that got hit this morning and called the low of the day to the tick! Prices reversed and we were able to close above both the midpoint of today and the IB high. As long as 1142 holds I am anticipating some follow through on today's closing action.

Bottom chart shows the 30 minute bars of the day session only (9:30am - 4:15pm). The 23% fib was also confluence for the -61% range extension support (number 1 trade). Made for a great long entry on first touch. The number 2 trade was the first test of the IB low, great short entry on first touch. Number 3 trade was the 50% pullback and the line in the sand that the bulls needed to defend in order to protect the low of the day from being broken to the downside.

As long as 1136's hold I have a target on this long trade of 1167's, the market will reach 1220's or more by summer, summer, summertime:)

Remember also this is FOMC week, it can get rather crazy especially from Wed 2:15pm until Friday close. Trade safe!

Wednesday, March 10, 2010

Wednesday March 10th Review


Continued strength in the markets, with the small caps and the Nasdaq already breaking January highs the Dow and S+P are lagging a bit, with the ES touching its January high today.

We had slightly above average range yesterday during the open outcry market, so are range extension targets especially on the upside would be reasonable fade entries.

The market opened in value from the previous day, and took off to the upside to form the initial balance. We had our first range extension area between the -23 and -38 zones conveniently at 1148 which was the January high.

You had to take this short entry on first touch with the market being a little overextended, made for a great fade. We came back inside range as initial sellers stepped up to the plate at the yearly highs. We ended up pulling all the way back to the midpoint support, point of control and IB high of yesterday which ended up being a great long entry back into the overall trend.

Bottom chart shows the market once again accepted value higher today.

Important note: the next two days will be difficult trading days, March futures contracts get liquidated into the June Contracts, rollover time. As well we have Options Expiration, we call this quadruple witching day (Friday). Don't be surprised to see a nice gap down tommorow, I would not be surprised to see a small break down to around 1126 or so during the next two days.

But its imperative to not overtrade the mess that will more than likely transpire the next 2 days. It may be best to take the next 2 days off, enjoy the family or the weather recoup and be back Monday. Not for me however, I will still be here:)

Tuesday, March 9, 2010

Tuesday March 9th Review


On the eve of the one year anniversary of the market bottom, it was only fitting to get some continued range extension to the upside.

Market traded lower in the overnight session, we touch the 100% range extension on the short side in overnight. This is calculated by taking the high to low of the previous trading day to come up with these range extension support/resistance levels for the next day.

As soon as we touched the range extension which was double the range of yesterday, we saw immediate short covering and initial buying. In fact we rallied all the way up to the 100% range extension level on the long side. Two great low risk trade entries that worked quite well today!

We continue to build volume value higher today (bottom chart) and closed above both point of control and midpoint.

However we are approaching the January highs again, I would not be surprised to see a minor reaction at these levels maybe back down to 1126 or so again.

But once again not to sound like a broken record, the market is ultimately headed for 1230's, at least!

Monday, March 8, 2010

Monday March 8th review


Well it was a rather uneventful day today as we had some consolidation of Friday's gains. The market built value around Friday's Point of Control (bottom chart) in a very small 4pt range in the open outcry markets. Yes it was like watching paint dry!

However the only real trade of the day was to short on first touch the first resistance level I posted yesterday on the Monthly chart. That proved to be the high of the day to the tick!!

Other than that not too much to say, bull/bear line will be 1126's. I expect to see this market crack the 1200 level before summer time.

Sunday, March 7, 2010

Weekly Update and next Resistance levels.


Hope everyone had a great week of trading! Even as short term traders it is imperative to ALWAYS know where we are trading in relation to the longer time frames. I try to bring this perspective from time to time to stay grounded and to realize the overall trend of this market. Most would argue that this can't be a Bull Market because of the circumstances we are in. While that is certainly true and the debate of whether this is a bull market or still a bear market can still be debated. I think most can and should agree that at least the trend even on the longer time frame charts is and has been extremely bullish for some time.

This last week proved the point exactly, we broke out of all the short setups we had from the January - February correction and more than likely will be testing previous highs, and breaking them.

Another thing I pointed out awhile back as to why I felt the market had NOT topped in January, we touched the 1148 high in the ES 2-3 times! The pros would NOT give us that many chances to catch a significant market top like that, by studying historical price action.

So now armed with this information, what should we be looking at for upside targets? Well my top chart shows the picture, I said 1230's will trade by summertime. The 1235 level is the 61% retracement from all time highs. We have 1200's which is the low created by the Lehman's Bros collapse and a significant double bottom we created back in early '08 coming in at 1250's levels.

All are serious targets that I am fully expecting to be hit, I believe this is a scenario where the market is moving higher to attract longer time frame sellers. The lack of overall volume tells me that so far the longer time frame sellers DON'T see these prices as high enough to get out of longs/ or establish new short positions.

Remember the longer time frame participants are the ones that move markets, so it is always imperative to see where they may come in. When they do come in, you will know. It will cause a supply/demand shock with unusually high volume.

As far as shorter term resistance levels, bottom chart shows the monthly chart with range extension targets. As the market continues to move up, if there happens to be a corrective reaction as it moves up, more than likely it will occur at one of these levels above for the month of March.

The 1140 level is currently where we are at right now, I wouldn't be surprised to see a 15 point or so correction around this level before moving to new highs. As always we'll just have to wait and see.

SIDE NOTE: I have begun to trade the Euro, it is an amazing market that has 5-10x the daily range of the S+P and has a 2008 style move every year!!!! It is a money making machine, and I am going to start to post reviews on the Euro as well as I get more familiar with this amazing market, anyone have any questions about trading this monster market, please feel free to let me know.

Here's to a great week of trading!

Friday, March 5th Review - NFP + Range Expansion!


Per my post in Thursday review, "range contraction leads to range expansion". We had just that from the begiining as overnight trading saw us breaking out above the top of the 3 day trading range we were in. NFP employment numbers came out and still the market was able to hold its overnight lows (very bullish). It was off to the races and up trend day was heavily in the cards.

Best trade of the day would have been buying the 1126's as market pulled back to test the previous trading range high. We were able to hold the 100% range extension resistance for most of the day, however we had consumer credit report come out late in the day, it was a very positive report which continued to fuel the fire for the bulls, and we saw more responsive buying taking us back into the range we were in, in January.

Once again, this market will more than likely be trading 1230's by summer time.

I will post some resistance levels and an update on the longer time-frame charts soon!

Thursday, March 4, 2010

Thursday, March 4th Review: Jobs Data


We had an inside day today, which means prices stay in the previous day's range. Range expansion leads to range contraction, which in turn leads to range expansion once again. So needless to say the jobs number tommorow I believe will provide more than enough ammuntion for some range expansion.

Top chart I am using the 30 min ES chart of day session trading only (9:30am-4:15pm). We opened in range and value, tested the Point of Control before heading lower. We then tested the previous day's low which saw some initial buying, which once again brought us back up to the Point of Control.

We closed above today's midpoint and point of control, possibly setting up for some decent jobs number. If I am reading this correctly, then I expect 1129's to get tagged tomorrow. Once again my Bull/Bear line is 1113, any time spent below that level is bearish for short term.

Wednesday, March 3, 2010

Wednesday, March 3rd Review


We had a typical rotation day in the markets with average volume and daily range. It was another uneventful day to say the least, and mirrored yesterday's price action rather well.

We gaped up but still opened in yesterday's value area, I really thought we would see a gap fill early on, but bulls defended yesterday's midpoint and off we went. Again notice the 23% range extension once again calls the high of the day to the tick!!!! Made for a great short entry, and turned out to be really the best/only decent trade of the day.

Just like yesterday, market rotates up to build volume value, eventually finds some sellers and rotates right back to its starting point. Again typical rotation day action, however these small daily ranges are quite frustrating. It would be nice to see the VIX back over 20 again, maybe we could get at least 20point S+P ranges once again.

My Bull/Bear line will once again be 1113, as long as price stays above that level, a test of 1129 is imminent, then 1149 before any correction may take place, on its way to 1230's. We did however close below the midpoint again for the second straight day. So we may very well be setting up for some weakness for the rest of the week, under 1113 expect to see some long liquidation as well.

We have unemployment claims tomorrow @ 8:30 AM, and Friday is Non Farm Payroll and Unemployment Rate, which is historically the most volatile day in the markets. Expect to see some range expansion either way for the rest of the week.

A couple of things I want to say on the lack of volume on this run up, one is to look at where market is accepting value, in other words don't focus on the total volume but focus on what price levels the volume is coming in at. Which is why I always display the volume profile charts for the day in my reviews. As long as the market accepts value higher, that is bullish, doesn't necessarily matter what the total number for the day is.

I believe the lack of volume is bullish, for it shows a lack of participation by longer time frame sellers. One of the many reasons I have explained for some time now, as to why I see higher prices in the near future. Longer term bears (ones with the real money to move markets) are waiting for higher prices, is my interpretation of this price action.

Again I am fully expecting to see 1230's trade by summer time, the only thing that would sway me would be acceptance of prices below 1050's.

Lastly, I have shown many the advance - decline chart of the NYSE, that shows extreme bullish levels, even surpassing those of the 2003 bull market and how it has bounced off its 20sma even before the correction last month ended. I gave two levels using recent price action that I believed the correction of the market would end, while the market was still selling off.

I said 1080 - 1068 would match the corrections we had last fall percentage wise, well we bounced off that level initially for some nice profits, but failed to hold.

The next zone I mentioned was 1045 - 1030, which would match the correction last June/July percentage wise. I said I couldn't get bearish until I see those levels taken out, because it would have broken the rhythm of the market all the way up from the March lows.

Well we hit 1040's and bounced, breaking short setups all the way up, in light of all the bearish sentiment out there, and if I am reading the tape correctly, we will see new highs in the not too distant future.

I say all of this not as a pat on the back for myself, believe me I am no guru. But too enlighten us traders to study PRICE ACTION and VOLUME only! I can not stress this enough, I made such progress as a trader when I learned this.

There is a rhythm to every market, it's up to us to figure it out. Let CNBC talk doom and gloom and end of the world scenarios, price action has been screaming bullishness since March. The bears will certainly have their way once again at some point, although I don't believe it will be anytime soon. Regardless when they do regain control there will be a rhythm to that market as well for us to follow.

My .02

Tuesday, March 2, 2010

Tuesday March 2nd Review: Bears defend the 76% retracement level!


Top chart displays the daily chart of the ES, using retracement levels from the January highs to the 1040 low, bears had only the 76% left to defend. They did a decent job of it throughout the day. Market was unable to break above it, stopping to the tick for today.

Second chart shows the intraday action, after a gap up in the overnight session, we tagged that 76% retrace level on the daily, which was sold into. That level happened to coincide with a range extension resistance level as well for today, so it made for a great shorting opportunity, not once but also in the afternoon into the close as well.

The problem with today's action was simple, we shot up too far too fast. No test of a value area or gap fill, that is why once the buying started to dry up we had to pull back into yesterday's value area to facilitate trade again. As I said, the market is always searching for fair value, where both buyers and sellers are evenly matched, until one overpowers the other the market will then move in that direction until it is met with opposition, and on and on.

Today was the classic example of that, not enough buyers to keep prices up, so we needed to pull back to test value and attract the bulls. However we did end up closing below the midpoint of today's action, and also closing below the Point of Control high value acceptance area for today (bottom chart). That is worth paying attention to as a cautionary measure. Let's see how we trade overnight for clues on tomorrow's price action.

My Bull/Bear line is going to be 1113 for tomorrow, I think we could come back and test that Point of Control and that would still be bullish. Market accepts value below there though, I will be bearish for tomorrow.

Monday, March 1, 2010

Monday, March 1st Review


Today was the first day of a new trading month, which is historically bullish. Couple that with it being a Mutual Fund Monday and well you have a serious potential for some bullish action. Market opened with an advance - decline line around 3to 4/1 in favor of the bulls and the tick stayed in positive territory for most of the first 30 minutes of trading, which is very bullish.

Top chart shows a 50% retracement from Friday's lows to Globex highs Sunday Night/this morning(#1 on the top chart). They bought that level, even front running it by a couple ticks, and it was up from there. A rather uneventful day after the am session however, our -23% range extension target calls the high of the day to the tick once again!

Volume Point of Control (bottom chart) comes in at 1114's. Midpoint of today's range is 1110's, that will be my line in the sand, bullish above/bearish below for tomorrow.

I believe the market is headed for 1129's first before any significant pullback reaction. if/when that pullback reaction occurs I expect the market to trade up to 1149's again by at least the end of the month of March, of course on its path to eventually trading 1230's by summer time!

Saturday, February 27, 2010

Friday, February 26th review

Rather uneventful day today, not a lot of traders in the NYSE pit today due to the storm. We had some consolidation of the gains on Thursday.

Globex session tested the 76% fib level mentioned in Thursday's review, after the opening bell we pulled back to test the Value Area high, which was also a 50% long from Thursday's low to the close. We had solid support in the 1094-1096 area there as 1094 which was my line in the sand was the midpoint of the entire day Thursday as well. That area held strong and was immediately met with initial buying from longer timeframe traders.

Not a whole lot of volume, so you really can't read anything into this. Next week should be interesting, Double Top to 1130's or pullback to midpoint at 1076-1079? That will be the question. Still holding firm to us seeing 1230ish by summer.

Trade of the day
1- Turned out to be the only trade of the day, buying the midpoint and value area high.

Thursday, February 25, 2010

Thursday February 25th, what a day!!!


Well what an amazing day we had today, I love this type of market! Obviously we saw weakness overnight and broke below my bull/bear line in the sand from yesterday's post. So was anticipating weakness in the morning.

Top chart is the 30 minute chart showing the last few trading sessions, from the most recent highs to Tuesdays sell off day. Wednesday was an inside day that retraced back to the 61% level for the bears. Bears defended it well, and later on defended the 50% retrace level, so lower highs lower lows, you know whatever the "news" or the unemployment claims data at 8:30 was, it was going to be sold into because of the current structure of the market.

Needless to say we sold off on the "news", check out the -23% range extension level on the charts, called the low of the day to the TICK!!!!! This is not a fluke, this is black box trading at it's best, and happens a lot. We rallied back up to test Tuesday's low, where we were met some more selling pressure.

Market retraced to test the Initial Balance low, and it was all downhill from there for the bears, as we rallied strong into the close on high volume!!

Now I felt like today was not going to be a downtrend day from the get go, the tape just didn't look right. Now I am more bullish than most in these times, but check out the third chart above. This is the VIX chart for the day, as you can see it was moving down pretty much all day, not confiming continued selling.

So we had a good day, what happens from here? Good question, check out the second chart above to see the 4hr chart of the ES from last lows to last highs, spanning about 2 weeks or so. We rallied back today again into the next measured move short on the longer time frame, when we hit the -23% target the bears handed the market back to the bulls to take over, now that we are in the next short setup the bears need to defend this setup or the correction will be over and 1130's will be achieved next, on the way up to 1230 in the next few months.

The key levels are 1102 - 1106 for the bears to defend, for the bears out there short these levels with stops above 1106 targeting the midpoint of this move up off the 1040 lows coming in around 1076.75. So your risking 4-5 points to potentially make 30pts, that's a great setup!

For the bulls, wait for a pullback to today's point of control to enter position, if 1106 seems to be holding abandon ship, if it breaks first target should be last highs at 1112.75, then 1130's. Not as good of a setup as the bears have right now, but still good enough.

We have GDP and New Home Sales as big economic news tomorrow, expect some decent action in the AM session at least. My bull/bear line in the sand for tomorrow is 1094ish.

Trade of the day
Obviously to buy the -23% range extension, trail it all the way up for big money!!!

Wednesday, February 24, 2010

Wednesday, February 24th Review, Bernanke does it again!


As I stated in yesterday's review, don't be surprised to see the bulls recapture most if not all of the losses from yesterday. Scenario played out beautifully!

As you can see in the top chart, the overnight session spent most of the time building value above the Value Area High (sign of strength), and opened just below it. Market internals were good as well. We had new home sales data come out, which was not very good at all. The market sold off right into the perfect long setup for the bulls at the Point of Control and IB low, you had to take this long position on first touch! Another reason why I say that market structure determines direction and not news, the news only provides a place to shake out or stop out weak money over to the pros. If you don't understand market structure, you won't understand why the market reacts the way it does to "news".

So the new home sales numbers shook out the weak longs and made for great long setup for the longer time frame buyers, as prices rallied fast without much pullback to jump in on. Rest of the day was uneventful as prices consolidated gains in the 1100-1105 area. Market closes just above today's Point of Control.

The volume chart shows you the value built higher from yesterday, with 1103 being the high volume value area. Tomorrow we have unemployment claims numbers @ 8:30am, my bias is bullish for tomorrow if prices can hold the 1098 level, below it more long liquidation may occur, and 1085 - 1087 will be my target. However I believe the market is headed for 1130 soon before any significant reaction will occur. 1230 area should be reached by summer.

Trade of the day
#2 - Long at POC and IB low off the New Home Sales data, doesn't get anymore easy money as that!

Tuesday, February 23, 2010

Tuesday February 23 Review, Consumer Confidence Dissapoints!


Well market had closed at it's highs the previous 5 trading sessions, so what do you do to alleviate the overbought condition? Send out some really bad consumer confidence numbers and bingo.... problem solved!

Market rallied and double topped during globex session, prices where immediately rejected as Dollar rallied and Euro sold off.

By 6:30am we were barely holding yesterday's IB low and well below Value area low. The market opened below value (sign of weakness), but A/D initially wasn't looking bad as Decliners had only a 1/1.5 advantage, initially this is a buying opportunity as Market internals not confirming price under value.

Thus we saw prices rally to test the Point of Control and close its gap around 9:47 am. Consumer Confidence numbers came out at 10am, they were well below estimates, thus bringing in longer time frame sellers and the market quickly sold off on the news.

A/D line became increasingly more negative after the numbers getting to -3/1, with heavy negative breadth as well.

The rest of the day was rather uneventful as bulls/bears battled, the bulls defended last week's midpoint and the bears tried to defend the IB low, market ended up closing inside the IB, but well below value.

Look for Bernanke tomorrow to move this market one way or the other, although we saw a lot of selling, the NYSE tick never hit any extreme levels, so it wasn't heavy volume panic selling. Don't be surprised to see this reverse and bears lose all of this ground tomorrow. Regardless, we must keep an open mind in this market.

Trade(s) of the day-
#3 -Short the Point of Control right before the numbers were released by far! It was a risky trade but would have paid off exceptionally well in a small amount of time. My type of trade!

#4 - Long at the -23% range extension off the IB, black box trading at its best!

Monday, February 22, 2010

Monday February 22nd Review


A rather uneventful Monday today, we had a typical rotational day building value higher and higher up the ladder. The advance-decline line was virtually flat the entire session. I haven't seen that in awhile, regardless there were trading opportunities outlined in the charts above still on a day like today.

After a small gap up into resistance during the globex session, we sold off and opened the day session at the value area high, we proceeded to close the gap in the first 30 minutes of trading.

There was the gap fill and the value area low (VAL) as confluence, that held all throughout the Initial Balance which offered a great low risk entry for a long. Once we bounced, we ran right into the Point of control, which we ran into more selling which knocked the market back near day session lows.

We then go on to make a flag formation, as buyers and sellers both compete for positions in a flat market. On the break to the upside, target should be now Value Area High (VAH) which again was met with sellers, right back into the VAL once again.

Even with the uneventful day, we still had opportunites to play ping pong with the value areas and make money, it is no coincidence that the market stopped exactly where it did. There is structure in Market Profile, these value areas are like magnets for price. They can be both targets and entries.

In a flat market like today, fading moves outside value areas are acceptable. When the internals are heavily favored in one direction, as in a trend day. Then it is ok to follow the trend by buying pullback to a value area.

Market is on its way to 1230's.

Sunday, February 21, 2010

The Big Picture

Here's a look at the big picture, using the weekly chart of the ES. Again the broken trendline which I pointed out in the middle of all that mess over in Europe, was what I believed was in play. Turns out I was right as we got the pullback into the long position.

I want to point out something, let's re-examine the sentiment that was in the markets on each low from the March lows. We made our market bottom in March when the government had just taken over 40% of some of the largest institutions in the country and complete nationalization was the heavy talk on the news.

We made our next low when the talk was "sell in May and go away" the dreaded head and shoulders pattern that even I must admit was caught up in. And once again the sentiment was, this is it for the markets.

We made our last low a couple of weeks ago when the talk of Greece and European debts made sentiment feel like fall '08 once again. We bottomed that weekend when things seemed like it was all downhill from here.

I want to point these things out to establish the pattern in this market. The usual pattern in a normal market is to be a buyer when things are bad, and when things look like they can't get any better, although it's not an invitation to sell right then, but to be cautious. Fall 'o8 was a historic event that only happens once a decade or generation. I am still bullish and am sticking with my prognosis of the 61% retracement level around mid 1200's probably by summer. The only thing that would convince me otherwise would be if markets accept value below SPX 1050.

Take a look at the drop in the SPX during June and the last drop in January, you will see a 9% drop each time. As long as the market keeps the rhythm there is really no need to get bearish yet.

Markets will always favor the long side, because of the potentially unlimited returns it brings, whereas shorts can only make 100% returns at best. This game is all about making money.

In conclusion, I believe the market will hit 1230's or so by summer. In any case I don't see any further weakness dropping any lower than SPX 875's. It would take a catastrophic event at this point to even get anywhere close to testing the March lows, at least for the rest of this year.

Again, just my .02

Saturday, February 20, 2010

Friday, February 19th Review


Wild day in the market, announcement of the Discount Rate sent some panic selling initially during Globex. My thoughts on what happened was it all was a hedge on options position and probably suckered in many bears along the way.

Regardless we continued to hold the 1093 volume area again, which triggered short covering. By the time markets opened we were back in value from the previous day.

We had some nice trading opportunities to ride out the short term trend. OPEX friday is usually not the day to take a bunch of trades, trades should be limited to high probability setups only.

At around noon the market hit an important level. The 2x or double the initial balance. This is a profit taking area on a black box level, and called the high of the day to the tick!!

Market closed @ 1106 which is right below the point of control for the day, these bulls are resilient.

High Volume area came in at
1108

Market Stats
IB Range - 6pts
RTH range - 12.25
Full day range - 18.50
Volume - 2,095,859

Thursday, February 18th Review


Market continued to hold high volume area at 1093's again in Globex session, moved higher and opened just below Wednesday's point of Control @ 1097. We broke weekly high during IB period which shows signs of strength. We pulled back immediately after the IB was formed, right into the magnet which is the VPOC once again @ 1097, which made for a great long setup.

The market was stuck in a flag formation throughout the afternoon session, broke to the upside and rallied into the close, once again closing at highs for the day. Resilient bulls again.

High volume areas created today:
1105
1099

Market statistics
IB range - 6.25
RTH range - 11pts
Full day range - 13.75
Volume - 1,831,933

Wednesday, February 17th Review


Today was an uneventful inside day in the market, not many setups. Market held one of the high volume areas at 1093 that was noted in Tuesday's review, during the Globex session and proceeded all the way up to 1100 which was pretty solid resistance.

IB opened up above Tuesday highs and value which is bullish, rallied back to the 1099 resistance level but couldn't maintain. Yesterday's gap became the magnet level for shorts.

We fell back into the gap fill and test of the high volume area held in globex, great low risk long trade entry. Probably the best of the day as we then proceeded to rally to close near highs of the day.

High Volume Level
1097

Today's Market Stats
IB Range 4.25 pts
RTH Range 7 pts
Full day range 7.5 pts
Volume 1,669,958

Tuesday February 16th, Day in Review


Three day weekend for the markets, globex session holds Friday's VPOC (Volume Point of Control) rallies past last weeks high which happens to be Friday's close and gap fill as well, comes back to test that same level during globex and bounces. So we had signals of strength early on.

9:30 am market opens at 1083.75, way above Friday's value and high, again signaling strength. The Initial Balance is the 9:30 to 10:30 am trading hour when most business transpires. Very important hour that you will hear me talk about a lot, I will refer to it as only IB for now on to simplify. We once again drop to test the high and close the gap during the IB period. It holds yet again, very bullish for the day, test of Globex highs at least coming.

We test globex highs around the 11am mark, it is met with some minor resistance initially. But gets broken to the upside by 12pm. Bullishness continues now as long as globex highs hold.

We see continued trading around this area for an hour or so, Globex highs still holding = bullish, odds favor a run-up into the close now. Which we get, market closes at it highs for the day. Bulls win for the day!

Volume profile chart shows heavy volume transactions at:
1093
1087.50
1084.50
1081 Price levels

Above chart shows ideal low risk trade setups given for today.

Final Day stats
Initial Balance Range - 5pts
Regular Trading Hours Range - 14.5pts
Full Day Range - 20.5pts
Volume - 1,874,920 contracts

Thursday, January 21, 2010

Day in Review....... Finally!

Well after the announcement of new reform plans for some of the too big to fail institutions we finally broke out of this range. Market has been consolidating in box formations like the one shown above break out and trend and back to consolidation again, that has been the pattern since March.

Trades for today, jumped in on the short side breakout CONFIRMED by VIX and daily volume. Covered @ 1113 and reversed long. Had about 5 pts in my favor, moved stop to break even and got hit. Gave up some nice paper gains, risks of trading only one contract I guess.

I am currently long ES again@1109 and holding overnight, why you ask? well the box trading range we were in was approximately 19pts. Subtract 19pts from 1128 (low of the previous box) and you get 1109. ES traded 1108.50 and has bounced, so far have caught the low of this reaction within 2 ticks, that's how we do things around here:) I expect a small gap up tomorrow as this is a low risk entry.

My current view is we are heading back down to close a gap @ 1097.75 pre-holiday. I don't see the market trading below 1085, so bears please don't get your hopes up on this one. Remember gaps ALWAYS get filled, we now have open gaps in the 1140's from yesterday and today.

Wednesday, January 20, 2010

Wednesday analysis


Not expecting a trend day today, consolidation in range is my best guess. Some Fib levels to keep a close eye on for long positions above. Also yesterday's volume profile chart, VPOC is 1144 keep that in mind as possible target for long trades today, remember market is always looking for value. Keep these high volume areas in mind for trade execution, good luck!